 elyob
elyob
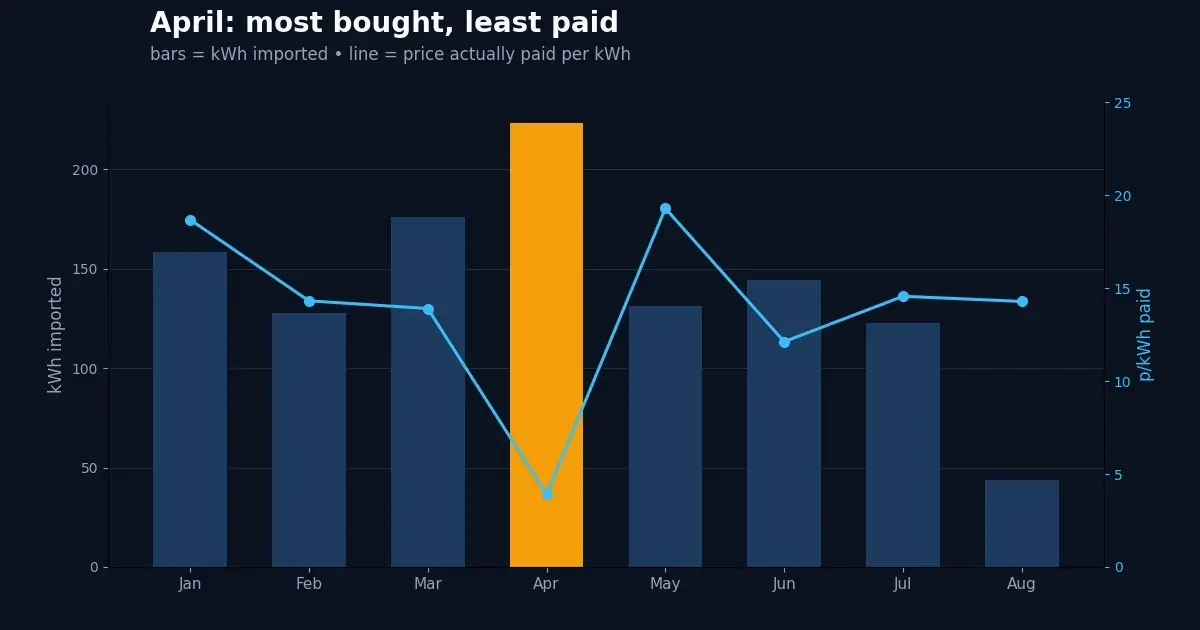
April 2026 was the month I imported more electricity than any other month this year — 223 kWh — and paid less for it than any other month: £8.73. That works out at 3.91p per unit, against a market average of 17.18p and a price cap of about 26p.
That isn't a typo, and it isn't clever accounting. It is what happens when a battery meets a month with 142 plunge half-hours — prices at or below zero.
What April actually did
Octopus Agile reprices every half hour. When there is more wind on the system than the country wants to use, the price falls to zero or below, and below zero anyone on Agile is paid to consume. April had 142 plunge half-hours out of 1440 — roughly one slot in ten for the entire month — bottoming out at -12.05p per kWh.
My charge planner treats a plunge price as an unconditional instruction: run the charger, regardless of how full the battery is or what the day's target was. A full battery simply floats while the microgrid runs the flat off the grid I am being paid to take. Over the month that came to 124.9 kWh billed at negative prices, earning £5.50 rather than costing anything (the billed credit, from Octopus's own half-hourly charges).
Of April's 142 plunge half-hours, the house drew power in 131 of them — a 92% capture rate. The eleven it missed are worth about £1. There was not much left on the table.
The table that makes the point
| Month | kWh | Paid | Plunge | Saved |
|---|---|---|---|---|
| Jan | 158 | 18.68p | 0 | £2.32 |
| Feb | 127 | 14.31p | 0 | £8.64 |
| Mar | 176 | 13.90p | 7 | £19.85 |
| Apr | 223 | 3.91p | 142 | £54.64 |
| May | 131 | 19.29p | 0 | £18.33 |
| Jun | 144 | 12.12p | 61 | £28.76 |
| Jul | 123 | 14.56p | 69 | £29.48 |
| Aug | 44 | 14.28p | 23 | £9.69 |
"Paid" is pence per kWh averaged over everything imported that month. "Plunge" counts half-hours where Agile was priced at or below zero. "Saved" is against the price cap, from the planner's own daily series.
The market average those months ran 23.5p in March 2026, 17.2p in April and 22.3p in May 2026, and the units bills were £24.48, £8.73 and £25.34.
Read the April row against the two either side of it. March 2026 imported 176 kWh at 13.90p. May 2026 imported 131 kWh at 19.29p. April imported 223 kWh at 3.91p — more energy than either, for about a third of the money.
The battery tells the same story from the other end: grid charging cost 6.19p per kWh in April, against 17.14p in May. Same hardware, same house, same software — different weather.
The grid meter agrees, from the other direction
I keep a separate page counting the days my solar beat the grid — days where the panels produced more than the grid supplied to the flat. It measures the grid that ran the house, not the grid that filled the battery, and it makes April look strange at first glance.
In April the flat drew 148 kWh from the grid — more than any other month this year, and roughly double May 2026's 64 kWh. A house that is trying to be self-sufficient took more from the grid, not less.
That is the plunge logic showing up in a second meter. When the price is negative, the sensible move is not to hide behind the battery — it is to run the whole flat off the grid I am being paid to take, and leave the battery alone. Every kWh drawn then is a kWh earned and a battery cycle saved. April looks like a bad month for self-sufficiency and was in fact the best month for money.
Even so, the panels still beat that inflated grid draw on 12 days of 30 in April, on the way to 91 such days so far this year. Two pages, two meters, two definitions — same conclusion.
And now the sobering part
May 2026 had zero plunge half-hours. Not few — none. The market averaged 22.26p and I paid 19.29p, which is to say I captured almost nothing, because there was nothing to capture. On roughly half of April's consumption, May's bill was £25.34 against April's £8.73.
That is the honest shape of this hobby. A battery and a tariff do not generate savings; they let me take what the grid is giving away, on the days it gives anything away at all. April saved me £54.64 against the price cap — the best month of the year. May managed £18.33 on the same kit, and I did nothing differently.
The one number I control is how much of the cheap stuff I catch when it appears. In April that was 92%. Everything else was the wind.
Every figure here is computed from the planner's own database at build time — half-hourly Octopus consumption and rates, daily solar yield and battery charge. "Saved vs cap" is the planner's canonical daily series, the same numbers the ROI tracker and my dashboard show: what this flat would have drawn with no battery and no solar, priced at the cap in force that day, minus what Agile actually charged and minus the standing-charge difference. More on the method in Price Capture, the day-by-day solar-versus-grid count on that page, and the running totals on the ROI tracker.
Corrected 26 September 2026. The plunge count now uses the same rule as my planner — half-hours where Agile was priced at or below zero — so March reads 7 (was 5); April stays at 142. The saved column follows the planner's re-settled daily series: April £54.64 (was £55.53), May £18.33 (was £18.74), with small moves in the other months.
April is still the best month of the year. The solar-beat-the-grid count moved too: 12 days in April (was 15) and 91 so far this year (was 96). Some of that is re-settled data; most is a fix to the daily solar figures, where on some days the panel meter had carried over the previous day's total.