 elyob
elyob
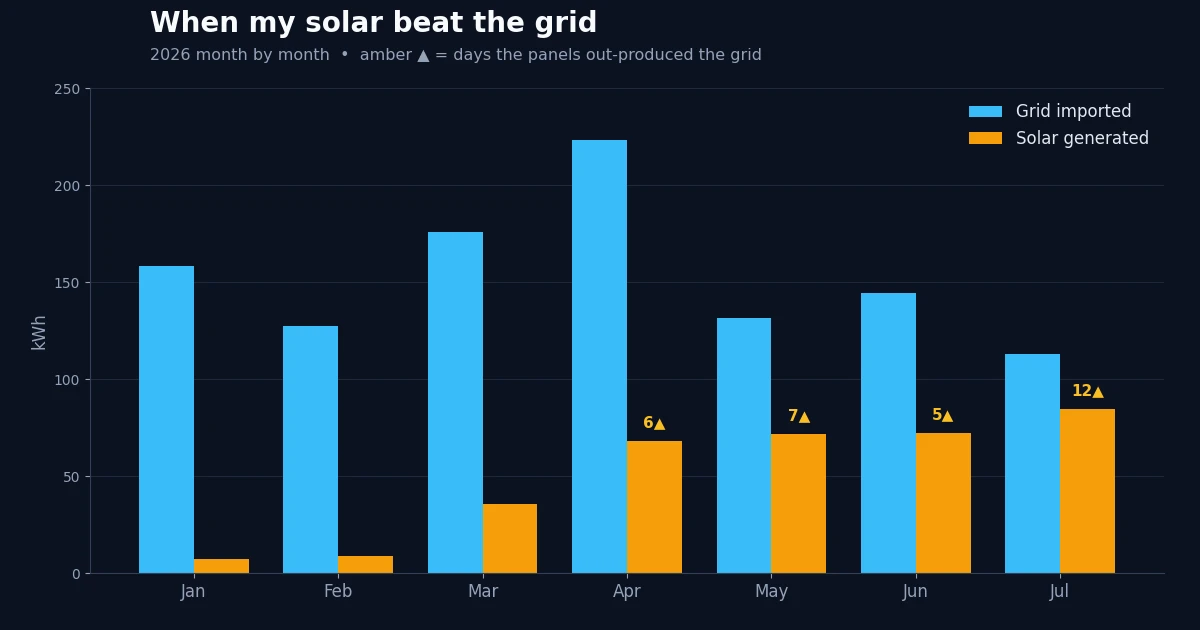
On 106 days so far this year, the ground-level solar panels in my garden made more electricity across the day than the grid spent running my flat. Not chipped in — beat it outright, midnight to midnight. For a small array behind a one-bed flat, that is a scoreboard I will happily take.
The wins bunch where the light is: 41 of 92 in spring, 62 of 92 in summer, 2 of 13 in autumn, 1 of 49 in winter. Winter, as a garden array well knows, contributes almost none.
July was the strongest month so far — 76 kWh of sun against 53 from the grid, with solar ahead outright on 25 separate days.
Two things about the table. The Solar and Grid figures are the win-days only — the sun and the grid on just the days the panels came out ahead. And the grid figure is what actually ran the flat: I set aside the cheap power I bank in the battery for later, since stockpiling is not the mains doing the day's work.
One honest asterisk. 28 of the days the panels “lost” were plunge days, when Agile prices went negative and it made no sense not to gorge on grid power. Of the 317 kWh I imported on those days, 235 fell in half-hours priced below zero — paid to me, not by me. Mostly the battery filling on free power, the rest the flat's always-on baseline draw earning on those slots rather than costing.
None of that grid-gorging is luck. The calls about when to pull from the mains come from a charge planner I built in the spring — it hunts the cheapest half-hours, dives on plunge windows, keeps a buffer for the morning, and defends a hard battery floor. I wrote up how it grew from a crude timer into that here.
I am not off-grid, and the year in full keeps me honest: across every day, not just the wins, about 450 kWh of sun against 626 the grid spent running the flat, so it still does most of the lifting. But the win-days are the good days earning their keep, and each brighter week adds another.
The months, side by side
| Month | Solar (kWh) | Grid (kWh) | Days solar won |
|---|---|---|---|
| Jan | — | — | — |
| Feb | 2 | 2 | 1 |
| Mar | 10 | 8 | 6 |
| Apr | 40 | 24 | 15 |
| May | 56 | 40 | 20 |
| Jun | 50 | 34 | 18 |
| Jul | 76 | 53 | 25 |
| Aug | 56 | 43 | 19 |
| Sep | 4 | 3 | 2 |
| 2026 so far | 294 | 206 | 106 |