 elyob
elyob
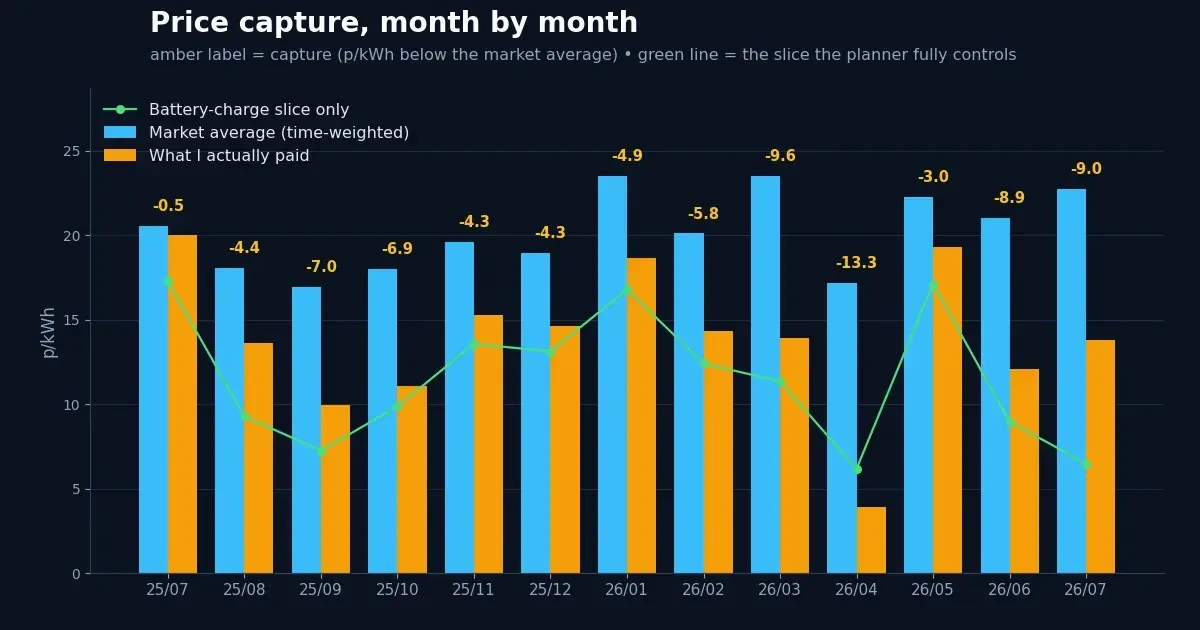
Compare this July to last and something looks wrong. Wholesale Agile prices were about 11% higher — 22.8p per kWh on average against 20.6p — yet my average unit price fell from 20.0p to 13.8p. Same flat, same fridge, same kettle. A dearer market, and I paid less per unit.
Most of the numbers I could quote for the battery — and have — are tangled up with things that are not the charge planner: sunnier months flatter it, a cold snap punishes it, a holiday empties the house and the bill. So this post is about the one number that is immune to all of that. I call it price capture: the average price I actually paid per grid unit, minus the time-weighted average Agile price that month. It measures exactly one skill — choosing when to buy — and nothing else. A shape-blind buyer scores roughly zero. Negative is good.
Through late 2025 I was picking the cheap windows by hand — a nightly glance at the rate chart and a plug timer. That era scored about -5.3p of capture, volume-weighted. Honest work, and already worthwhile. Since January the planner has run the buying on its own, and the same figure is -8.3p — roughly double the discount, on a slice of demand a timer cannot chase: half-hourly prices that move every day, plunge events that appear with a few hours' notice, a battery that needs filling exactly as far as tomorrow's sun won't cover.
The extremes tell it best. April was a plunge festival: 125 kWh of my imports were bought at negative prices — I was paid £5.50 to take them — and the month landed at 3.9p against a 17.2p market: -13.3p of capture. The battery itself filled at 6.2p a unit.
May looks like the planner fell asleep — -3.0p, the weakest month since the hand era. It didn't. May's market had no troughs to buy: the average daily minimum price was 15.7p, against 5.7p in April. When the cheapest half-hour of a typical day is 16p and the average is 22p, there is simply less spread to capture — and with the sun covering most of the battery's needs, hardly any volume to capture it with. Capture is the product of the spread on offer and the share of your buying you can actually shift. May offered neither.
Which is why the green line on the chart is my favourite: the price of the battery-charging slice alone, the only part of the bill the planner fully controls. In July that slice cost 6.5p a unit in a 22.8p market — a 71% discount. The rest of my average is dragged up by the always-on baseline — the fridge does not care what electricity costs at 6pm, and no planner can teach it to.
Thirteen months, one metric
| Month | Grid kWh | Paid p/kWh | Market p/kWh | Capture | Battery slice |
|---|---|---|---|---|---|
| July 2025 | 84 | 20.0 | 20.6 | -0.5 | 17.3p |
| August 2025 | 158 | 13.7 | 18.1 | -4.4 | 9.3p |
| September 2025 | 142 | 10.0 | 17.0 | -7.0 | 7.3p |
| October 2025 | 179 | 11.1 | 18.0 | -6.9 | 9.9p |
| November 2025 | 185 | 15.3 | 19.6 | -4.3 | 13.6p |
| December 2025 | 191 | 14.7 | 19.0 | -4.3 | 13.1p |
| January 2026 | 158 | 18.7 | 23.5 | -4.9 | 16.8p |
| February 2026 | 127 | 14.3 | 20.1 | -5.8 | 12.4p |
| March 2026 | 176 | 13.9 | 23.5 | -9.6 | 11.4p |
| April 2026 | 223 | 3.9 | 17.2 | -13.3 | 6.2p |
| May 2026 | 131 | 19.3 | 22.3 | -3.0 | 17.1p |
| June 2026 | 144 | 12.1 | 21.1 | -8.9 | 9.0p |
| July 2026 | 114 | 13.8 | 22.8 | -9.0 | 6.5p |
The other curve: the commit log
Capture is the output. The input is git. The planner lived inside my home-automation monorepo until 8 July, when it moved into a repository of its own; counting across both, the planner-related commits run 17 in April, 36 in May, 14 in June — and 118 in July.
May is my favourite row in that series. The weakest capture month since the hand era was also the heaviest month of rework — that was when the hand-me-down slot-picking heuristics began giving way to a proper linear-programming optimiser, with all the scaffolding, shadow-testing and second-guessing that entails. The payoff did not land in May. It landed in June and July: nine-pence capture months in dear markets.
And July's sprint reads like a changelog of lessons learned the hard way: an emergency tier that defends the battery floor at any price; a watchdog bug that once drained the battery overnight, closed as a bug class rather than patched as an instance; the planner learning to keep planning when its price forecast goes dark; and the forward chart taught to stop inventing charges the hardware would never perform. Two version tags inside a week. The two curves agree: the planner buys better because it is being worked on — and capture is how I know the work is landing.
The honest asterisks
Three of them. First, my benchmark is the time-weighted average — a buyer with a flat profile. A real household skews toward the expensive evening, so if anything this understates the saving against how I would actually have bought. Second, July 2025 is a half month — the meter moved to Agile mid-July — and its −0.5p is the closest thing I have to a proper control group: me, buying without looking. Third, capture says nothing about how much I bought or what the battery loses on the round trip. Those live in the ROI post. This number only judges the timing — which is precisely why I trust it.
Data: Octopus half-hourly billing and rates to 2026-07-28, from the planner's own database; commit counts mined from the two (private) repositories' histories. This post was computed, not written from memory — the script that builds it runs against the same tables the planner plans from.