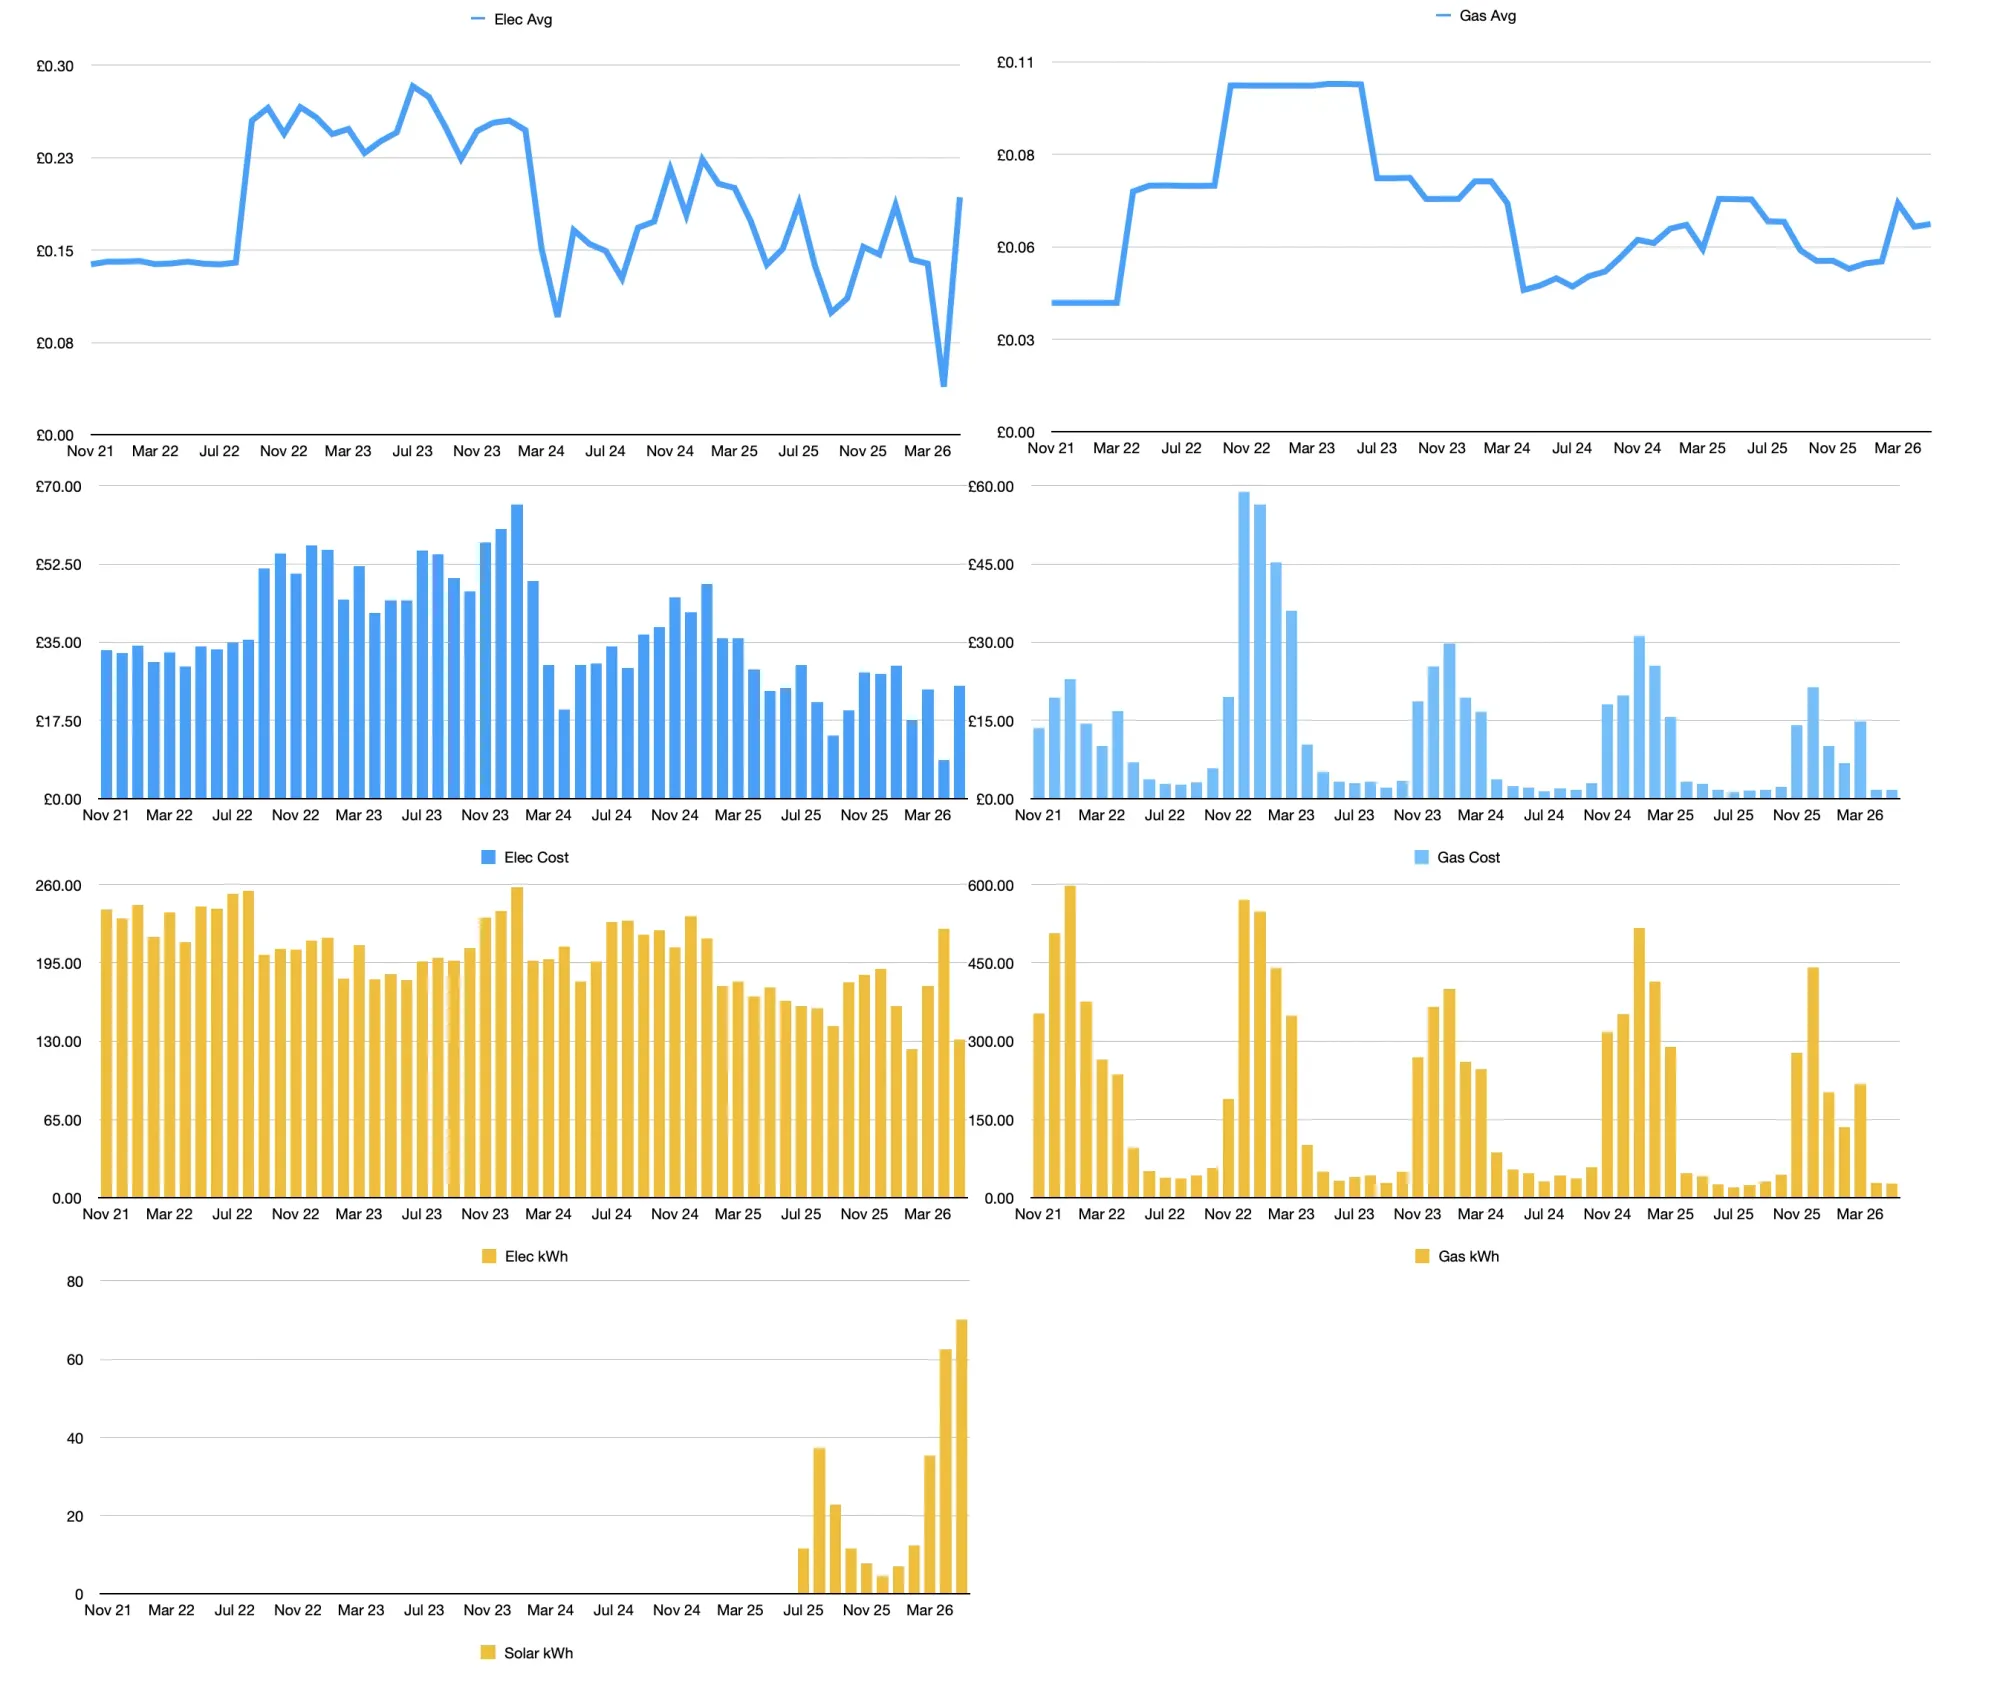
A friend asked me what the energy crisis looked like on a normal household bill. So I pulled five years of monthly readings from Octopus into one chart — electricity and gas, average unit price and total cost, kWh used, and the new line at the bottom: solar generation. It tells the story better than any headline did at the time.
The chart embedded as the feature image is split into five pairs: average unit price (top), monthly bill in £ (middle), monthly kWh used (yellow bars), and solar production along the bottom. Everything's plotted on the same time axis — Nov 2021 through to May 2026 — so the eras line up. The story lives in four phases.
| Era | Elec p/kWh | Gas p/kWh | Monthly elec £ |
|---|---|---|---|
| Pre-war calm Nov '21 → Jul '22 | ~14p | ~4p | ~£30 |
| Crisis Aug '22 → Mar '24 | 28–30p | ~10p | £55–65 |
| Rebound Apr '24 → Jul '25 | 17–22p | 5–7p | £25–40 |
| Solar + Agile Aug '25 → now (data era) | 3–19p effective | 5–7p | £8–25 |
🌱 2021–22: The cheap-energy baseline
From the start of the chart through about July 2022, my electricity average sits at ~14p/kWh and gas at ~4p/kWh. Monthly electricity bills hovered around £30, gas was £15-25 in winter and almost nothing in summer. Boring numbers, boring lives, no kit. Nobody talked about energy prices.
This was the world before the wholesale shock — gas storage levels normal, generation healthy, Europe was buying Russian gas on long contracts at sensible rates. It feels archaic to look at now.
🔥 2022–24: The Ukraine spike
Russia invaded Ukraine in February 2022. The wholesale gas market — and electricity-from-gas, which sets the UK marginal price — detached from sanity by autumn. The chart shows it plainly: my electricity average jumps from 14p to ~28-30p/kWh over a couple of months. Gas roughly triples to ~10p/kWh. Both stay parked at those levels through the whole of 2023.
The monthly bill bars in this period are stark. Electricity hit £55-65/month for most of late 2022 and 2023, against the £30 baseline. The single tallest gas bar — November 2022 — was almost £55, when in pre-war times the same month would have been £20. Two winters of "leave a jumper on, the heating's expensive," all flowing through that smart meter.
The government's Energy Price Guarantee took the edge off the unit rate, but every extra kWh still cost noticeably more than before. The bills don't lie about that.
The cliff has receded but the ground it left behind is permanently higher.
🌅 2024–25: The partial rebound
By spring 2024 the wholesale market loosened. My electricity unit price drifts back to ~17-22p/kWh, gas to ~5-7p. Still about 50% higher than pre-war on electricity, never quite returning to that 14p baseline. Monthly bills stabilise around £25-40 elec, gas visible only in winter spikes of £15-30.
This is the new normal. Anyone hoping for a full snap-back can keep hoping.
☀️ Mid-July 2025: Proper kit arrives
The bottom strip of the chart is empty until the rightmost ten or so months. There was actually a smaller setup before that — an Anker PowerHouse 757 (1.2 kWh portable) bought back in October 2022, with three panels feeding it, scrapping data off the screen via a Blink camera and OCR. Functional but fragile. I don't trust those numbers, so the chart doesn't show them — that's the "bad data period" before the proper kit went in. The full Anker story is in Nearly Five Years of Home Energy.
On 15 July 2025 I sold the Anker and installed the proper system: four 100W panels at first, ground-mounted on a salvaged-pallet frame in the garden (no roof access in this 1-bed flat), a 6.7 kWh Fogstar Drift LFP battery on a board indoors, with the MPPT and inverter alongside. Nothing fancy. About £2,200 of kit. 23 November 2025 brought panels five and six (600W array), then the seventh panel in late April 2026 (700W).
Reliable logging caught up by August: 25.6 kWh in that first complete month, against ~210 kWh of household load. Useful, not transformative. UK winter is exactly as bad as the brochures don't tell you — December dropped to 4.5 kWh for the whole month.
The smart-meter baseload halved
One immediate structural change the kit made shows up in the smart meter's idle draw — the wattage the meter sees during the deepest part of the night, when nothing is being actively used. Octopus's current_demand sensor has been logging this every minute since June 2025, so the kit-arrival cliff is right there in the data:
| Month | Baseload (W) | Bar |
|---|---|---|
| Jun 2025 pre-kit | 106 | |
| Jul 2025 kit installed 15th | 96 | |
| Aug 2025 microgrid takes over | 43 | |
| Sep 2025 | 34 | |
| Oct 2025 | 36 | |
| Nov 2025 | 37 | |
| Dec 2025 | 39 | |
| Jan 2026 winter bump | 47 | |
| Feb 2026 | 37 | |
| Mar 2026 | 37 | |
| Apr 2026 | 37 | |
| May 2026 fans on | 39 |
The microgrid moved the always-on cluster — desk lights, TV, routers, two micro-PCs, set-top boxes, e-bike trickle charges — off the smart meter and onto the battery. What the meter still sees is the kitchen-side stuff (fridge, vampire loads from the gas boiler and the wider house, anything not on the microgrid). Net effect: the meter's idle wattage roughly halved, and stays there year-round apart from a small winter bump (heating standby) and a small summer bump as fans started in late May.
Solar generation since install, by month:
| Month | kWh | Bar |
|---|---|---|
| Aug 2025 | 25.6 | |
| Sep 2025 | 22.8 | |
| Oct 2025 | 11.4 | |
| Nov 2025 | 7.8 | |
| Dec 2025 | 4.5 | |
| Jan 2026 | 7.2 | |
| Feb 2026 | 8.8 | |
| Mar 2026 | 35.8 | |
| Apr 2026 7th panel | 68.0 | |
| May 2026 | 71.6 |
⚡ October 2025: Octopus Agile
In October 2025 I switched to Octopus Agile — half-hourly variable pricing, including the legendary occasional negative-rate "plunge" slots where Octopus literally pays customers to consume. April 2026 alone had 142 negative-rate slots, with the deepest at -12.05p/kWh. That month my effective rate per imported kWh was 3.91p, vs the cap's roughly 28p. The April electricity bill came in at £8.73, against a counterfactual cap bill of £68.94 for the same usage.
For the first few months on Agile I ran with simple Home Assistant automations that picked cheap slots overnight. It worked, but the corner cases — sunny days, deep plunges, weather forecasts — were left on the table. So in April 2026, when I wrote my first post about how the system manages itself, I started building it properly: a planner project that has been evolving ever since and is still being fine-tuned today.
The planner runs every half hour. Each tick it pulls in tomorrow's published Agile rates (where available) and a predicted-rate sensor for the slots Octopus hasn't published yet, the Solcast solar forecast for the panels, current battery SOC, and a rolling daily-usage average. It then books just enough charging — never a kWh more — at the cheapest moments between now and the next 16:00 publish. The battery covers most house load through expensive hours; the smart meter barely sees usage between 4pm and 7pm.
Across the nine months on Agile the arbitrage slice has accumulated about £70 of pure profit on top of the regular solar/battery savings. Buy cheap, store, use during expensive. Octopus doesn't mind — they're balancing the grid. I don't mind — the bill keeps shrinking and the planner keeps getting smarter.
🌻 March 2026 onwards: Spring turns the corner
The solar bars start climbing fast. March 35.8 kWh, April 68.0, May 71.6 kWh. The seventh panel was added in late April, taking the array from 600W to 700W just as the longer days arrived. Best single day so far: 3.45 kWh, in May. Clear-sky days now sit at 3.3-3.5 kWh, cloudy days at 1.5-2.5.
The May electricity bill was £21.47 — for the same household load as the £55 bill in March 2023. Solar covers about 60% of household demand outright. The battery and Agile together cover most of the rest at sub-15p/kWh.
Solar generates what it generates. The battery and Agile turn the grid from an enemy into a flexible buyer–seller.
2026 so far: usage by month
Zooming in on the current year tells its own story. Grid kWh imported month by month, against direct-load consumption and solar generation:
| Month | Grid kWh | Bar | Solar kWh | Bill £ |
|---|---|---|---|---|
| Jan 2026 | 158.3 | 7.2 | 29.57 | |
| Feb 2026 | 127.5 | 8.8 | 18.24 | |
| Mar 2026 | 176.1 | 35.8 | 24.48 | |
| Apr 2026 plunge | 223.2 | 68.0 | 8.73 | |
| May 2026 | 122.5 | 71.6 | 23.50 |
Reading top to bottom: grid kWh trended down through February (127.5 — the lean month, fewer dark days, no spikes), climbed through March as winter held on, then April looks anomalous at 223.2 kWh. That April figure isn't real demand — it's deliberate consumption during negative-rate slots Octopus paid me to use.
Direct-to-loads alone hit 161 kWh that month — four times the usual — because I deliberately ran appliances during the deepest plunges. The smart meter sees a "spike" that's actually a profit.
May is the cleanest signal yet: 122.5 kWh of grid import, the lowest since February, with 71.6 kWh of solar doing the heavy lifting alongside the battery. May 2025 (pre-solar) was 174.7 kWh for the same flat — so May 2026 is ~30% less grid for the same household. Solar contribution and grid reduction line up almost exactly, which is the cleanest possible signal that every kWh the panels generate gets used.
The bill column tells the parallel story: April's £8.73 was a freak (plunge credits absorbed most of the unit cost), but every other month sits in the £18-30 range — well below the cap counterfactual of roughly £40-55 for the same usage. The Agile + battery + solar combination is now the load-bearing piece of the household energy budget.
What the five years actually say
Compressed into one paragraph: cheap energy gave way to crisis, the crisis gave way to a new permanently-elevated normal, and at that point I stopped trying to ride out the wholesale market and bought tools to bypass it. The planner extracts the cheapest possible source for every kWh I actually consume.
Roughly £200 saved against the price cap over the 318 days since install. A modest number in absolute terms, but the curve points down while the world points up. The 7-panel array is at near-peak summer output now; the savings line should climb steeply through to August.
If a war or another wholesale shock happens again — and looking at the geopolitics, it might — the bill chart will still react, but the kit between it and the grid will absorb a lot of the blow this time around. That's what the last bars on the right are showing. That's what cost the kit. That's why it was worth doing.