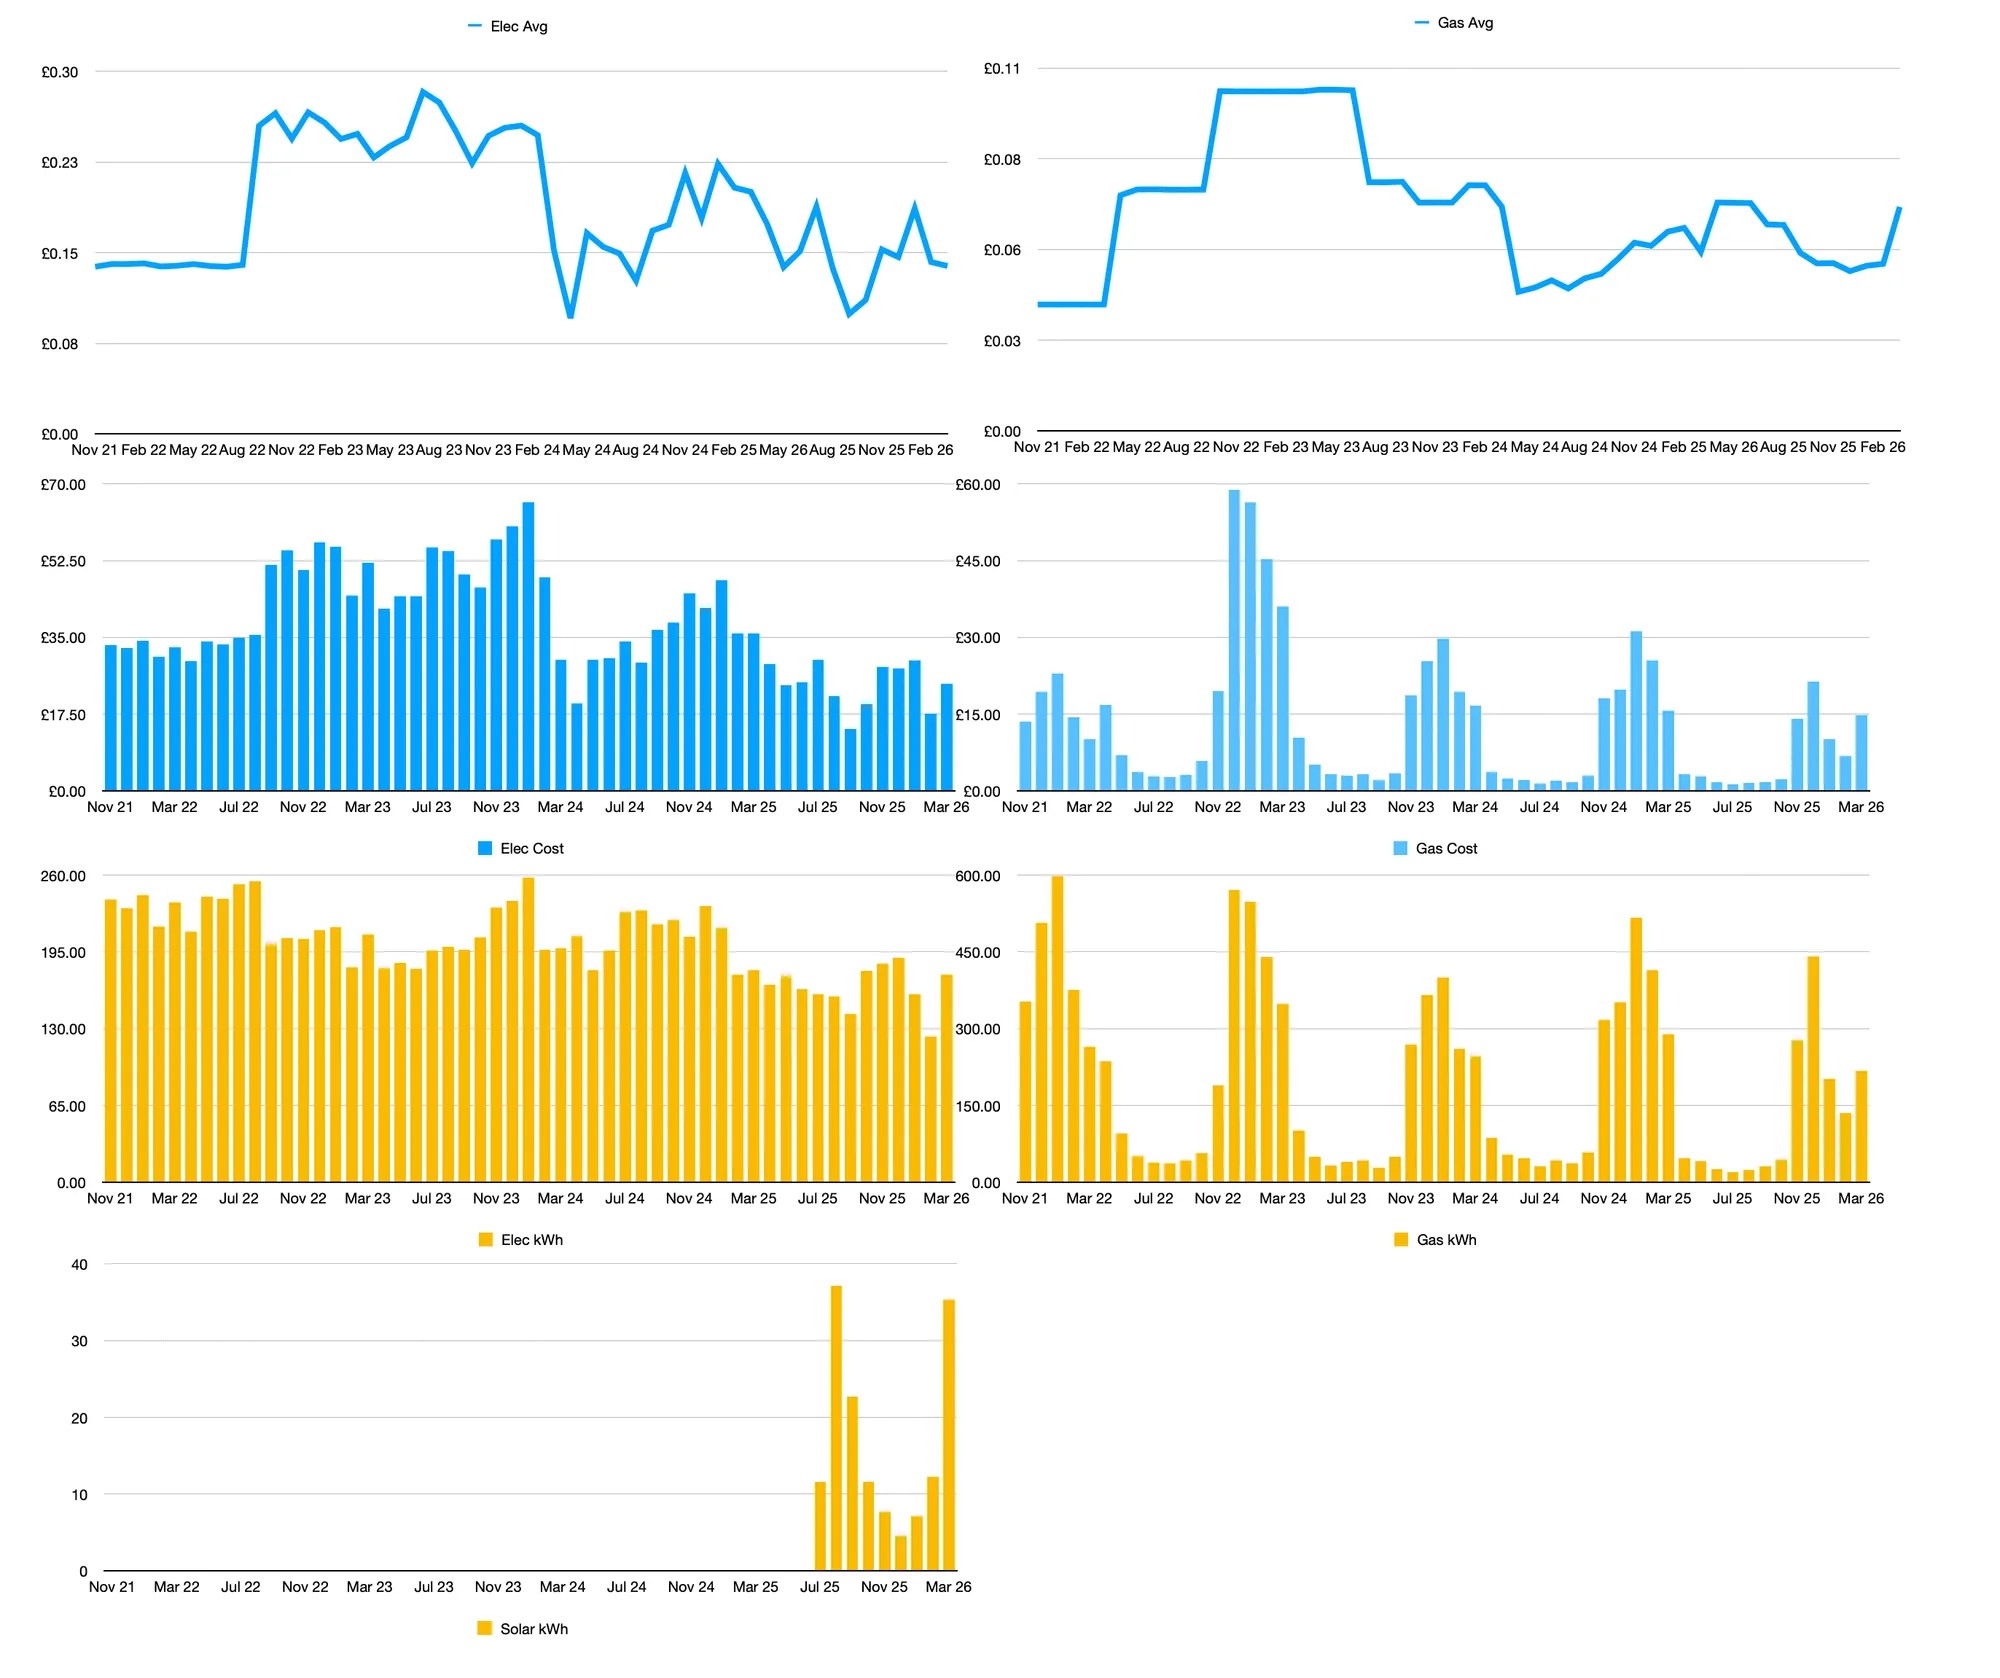
It's strange to look at a chart that spans almost five years and see it all compressed into a handful of coloured bars and squiggly lines. But that's exactly what I've got here — every unit of electricity and gas I've used since I started tracking in November 2021, right up to March 2026. And honestly? What a ride.
The Energy Crisis, Captured in a Chart
When I moved in, my electricity unit rate was sitting around £0.14–0.15/kWh — on Octopus Go,† which gives a fixed cheap overnight window alongside a standard day rate. Pretty normal, nothing dramatic. Then the line just... climbs. By mid-2022 it had shot up past £0.25/kWh, peaking somewhere around £0.28–0.29/kWh. Gas told an even wilder story — from about £0.04/kWh when I arrived, rocketing up to over £0.10/kWh through the winter of 2022–23. I remember opening those bills and feeling genuinely winded.
The monthly cost bars tell the same story in a different language. My electricity bills through those crisis winters were regularly hitting £50–£65 a month. Gas was spiking to £45–£50 in the coldest months, with one particularly brutal period around November 2022 where it touched close to £50. These weren't abstract numbers — I was absolutely rationing the heating and tracking every penny through the Octopus Mini — a small device that reads the smart meter and pushes consumption data to the Octopus API every 10 seconds. The display unit itself went straight in a box. Instead, near real-time usage data flows into Home Assistant (HA), where it actually becomes useful.
The Long Plateau
Things did come down. By 2024 my electricity rate had dropped back toward £0.14–0.16/kWh and gas settled into the £0.05–0.07/kWh range. Usage costs fell with them. But I was still spending £25–40/month on electricity and the gas costs, while lower, were still there every winter. Nothing had fundamentally changed about how I was using energy. In March 2024 I switched to Octopus Agile† — half-hourly pricing that tracks the wholesale market — which set the stage for everything that followed.
October 2022: The PowerHouse Experiment
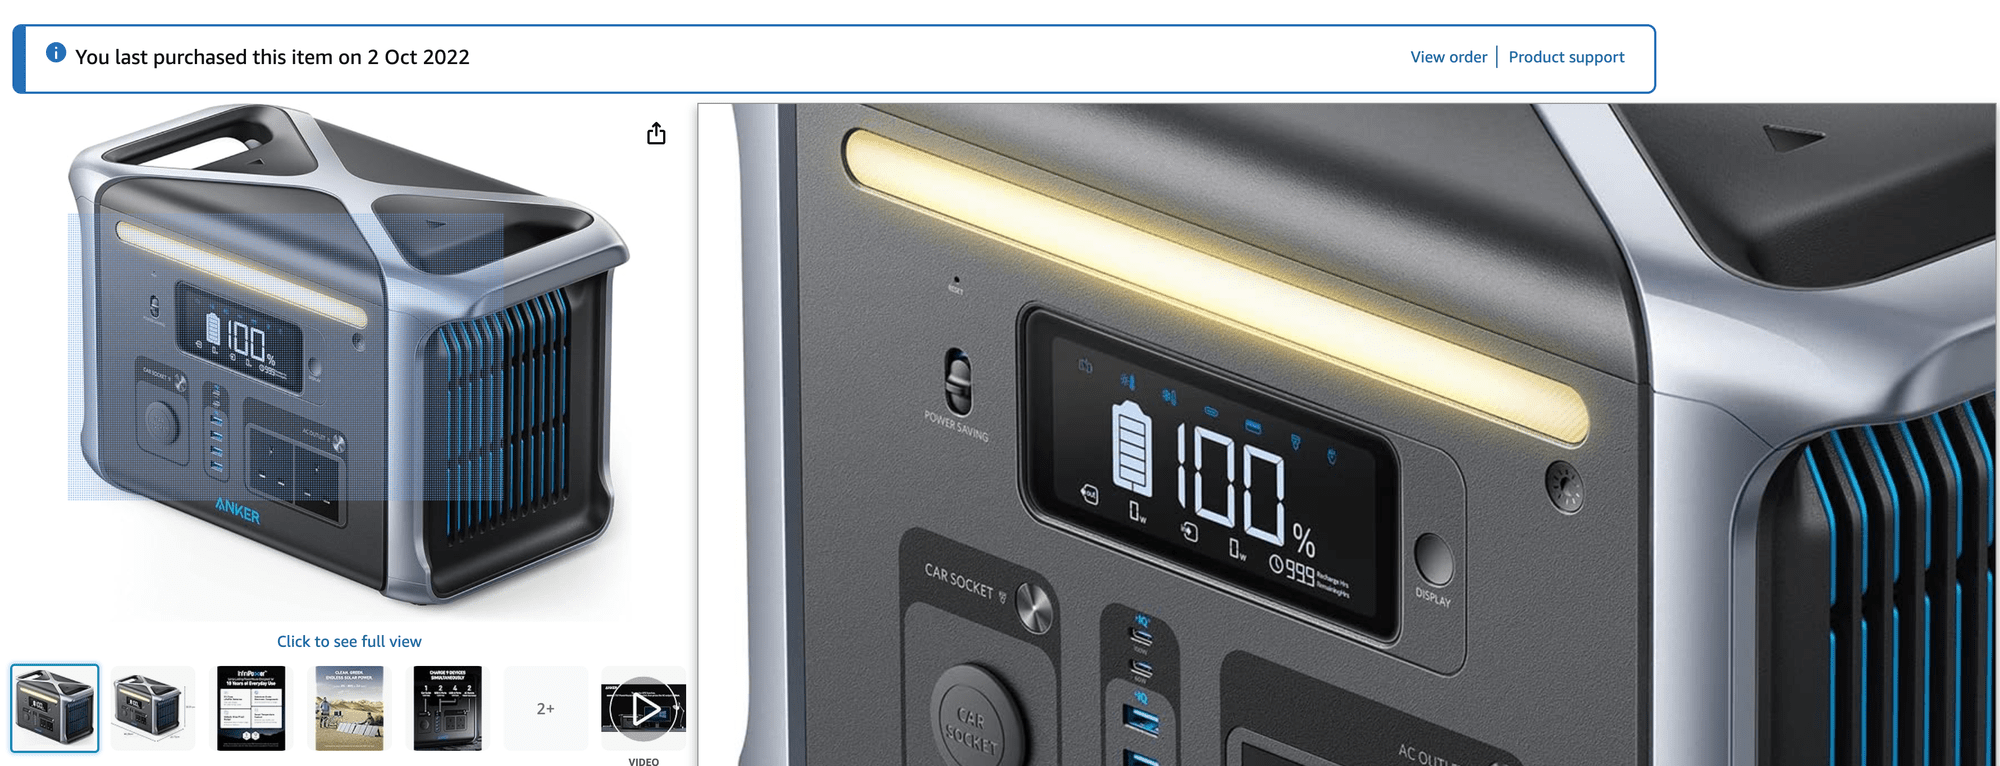
Before the proper solar build, I had been experimenting since October 2022 with an Anker PowerHouse 757 — a 1.2kWh portable power station bought right in the thick of the energy crisis. Getting data out of it was a project in itself: a Blink camera photographed the front panel display, a Zigbee FingerBot pressed the button to wake the screen up, and OCR software read the charge percentage from the resulting image. It mostly worked, right up until something nudged the camera or the unit slightly and the whole pixel-level OCR positioning had to be recalibrated from scratch. Functional but fragile. I sold it in July 2025 when the proper system went in.
Three solar panels were connected to it — the fourth could not be added without exceeding the PowerHouse's maximum solar input rating, so it sat unused. With three panels feeding into a 1.2kWh battery, on a decent day the unit would charge fully from solar alone, meaning that 1.2kWh of daily consumption was effectively free. At crisis electricity rates of £0.29/kWh, a full daily cycle from solar was worth around £0.35 — call it £5–8/month in a reasonable month once weather and shorter winter days are factored in.
One advantage the PowerHouse had over the current setup was charge speed. The 1.2kWh battery could be fully recharged from empty in around 1.5 hours from a wall socket — useful for topping up quickly if needed. The Fogstar is a different proposition entirely: at 560Ah (6.7kWh), the Fogstar-branded LiFePO₄ charger (14.2V / 50A, 710W output) takes roughly 11–13 hours for a full charge from empty. Not a problem in practice — it charges overnight on cheap Agile slots — but there is no equivalent of plugging in for 90 minutes and being done.
The load it was running was modest: a computer, a monitor, and two small televisions. That was it. The main value was riding out the evening peak — keeping those devices off the main grid during the most expensive hours of the day. Meaningful compared to doing nothing, but still a fraction of the £60–115 combined bills at the time. The 1.2kWh ceiling was always the constraint. The panels could generate more than the battery could hold, and once it was full that was it — no way to store or use the rest. The proper build was always going to be about fixing that ceiling.
July 2025: The Real Turning Point
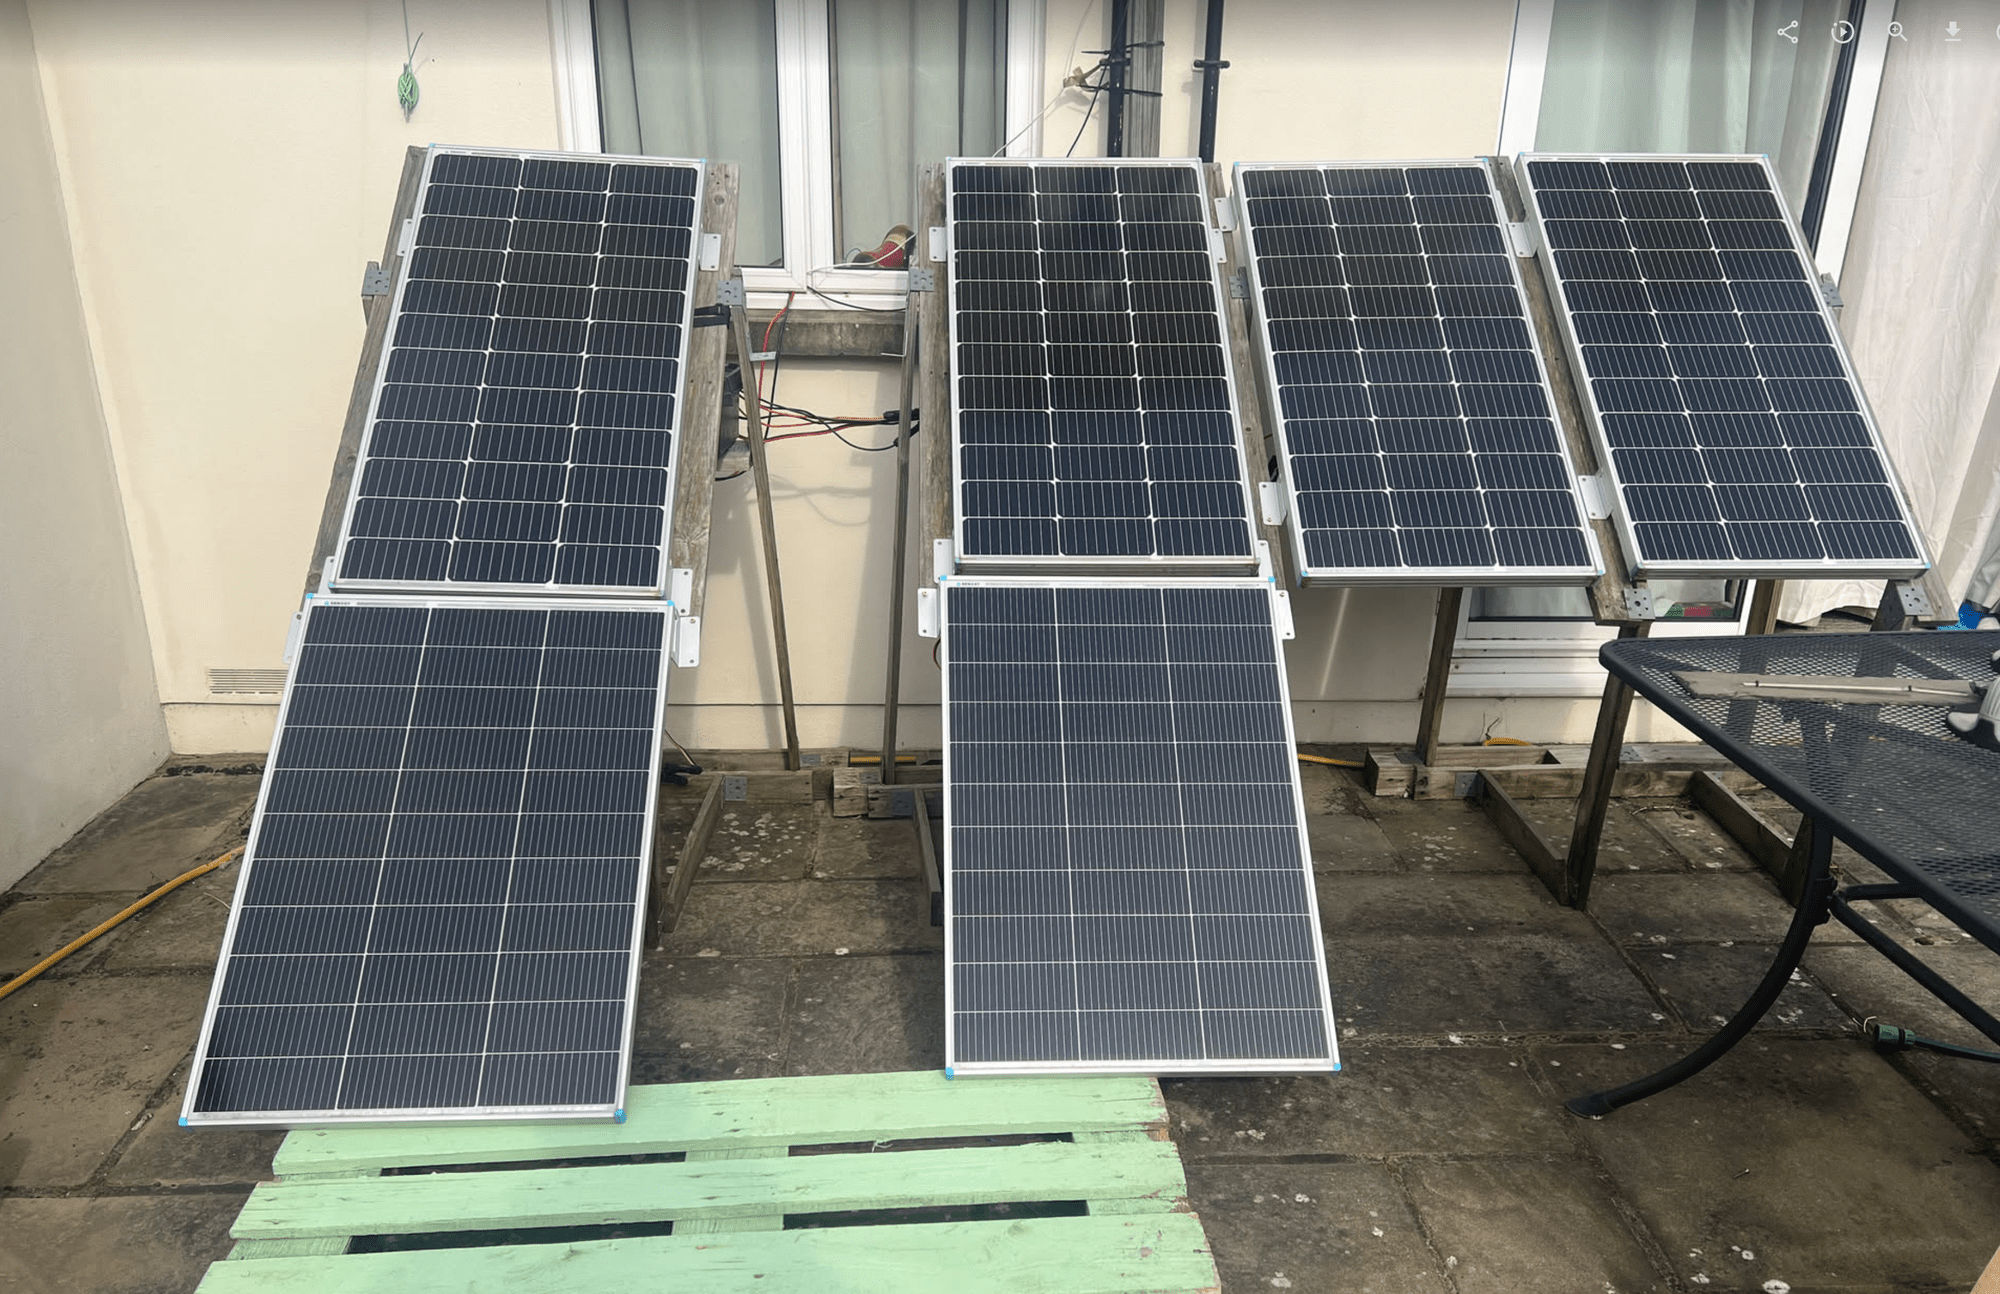
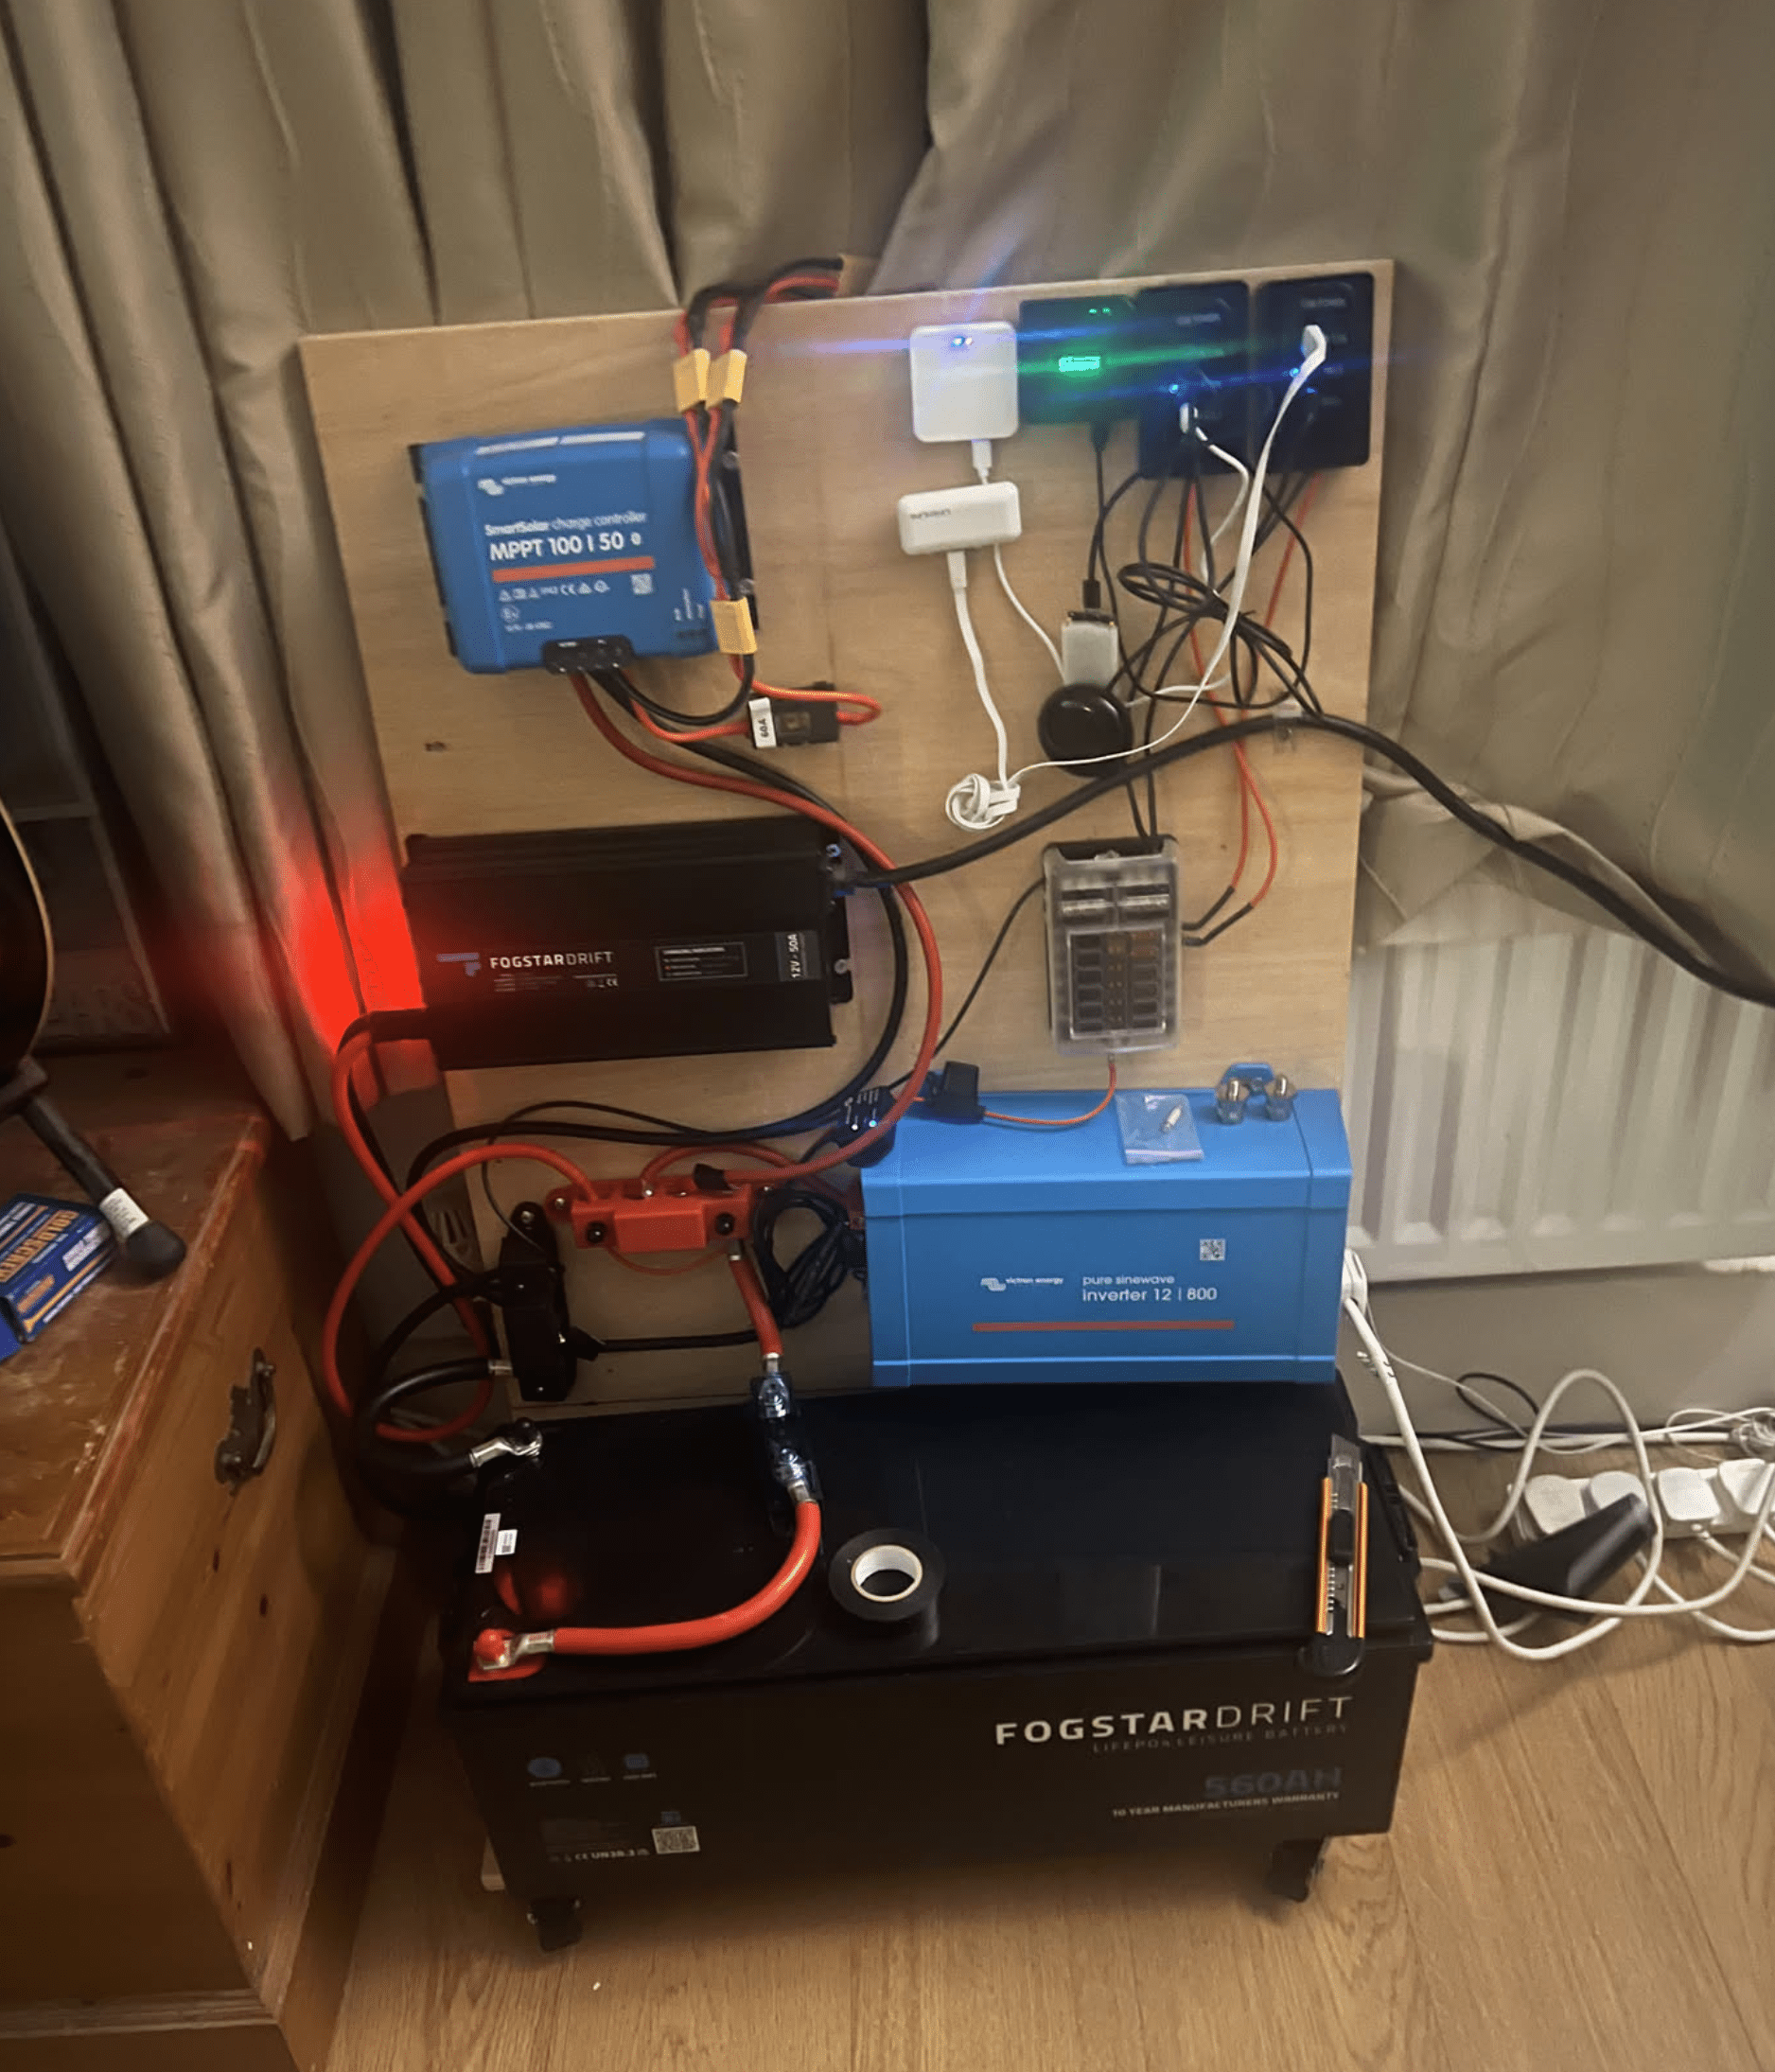
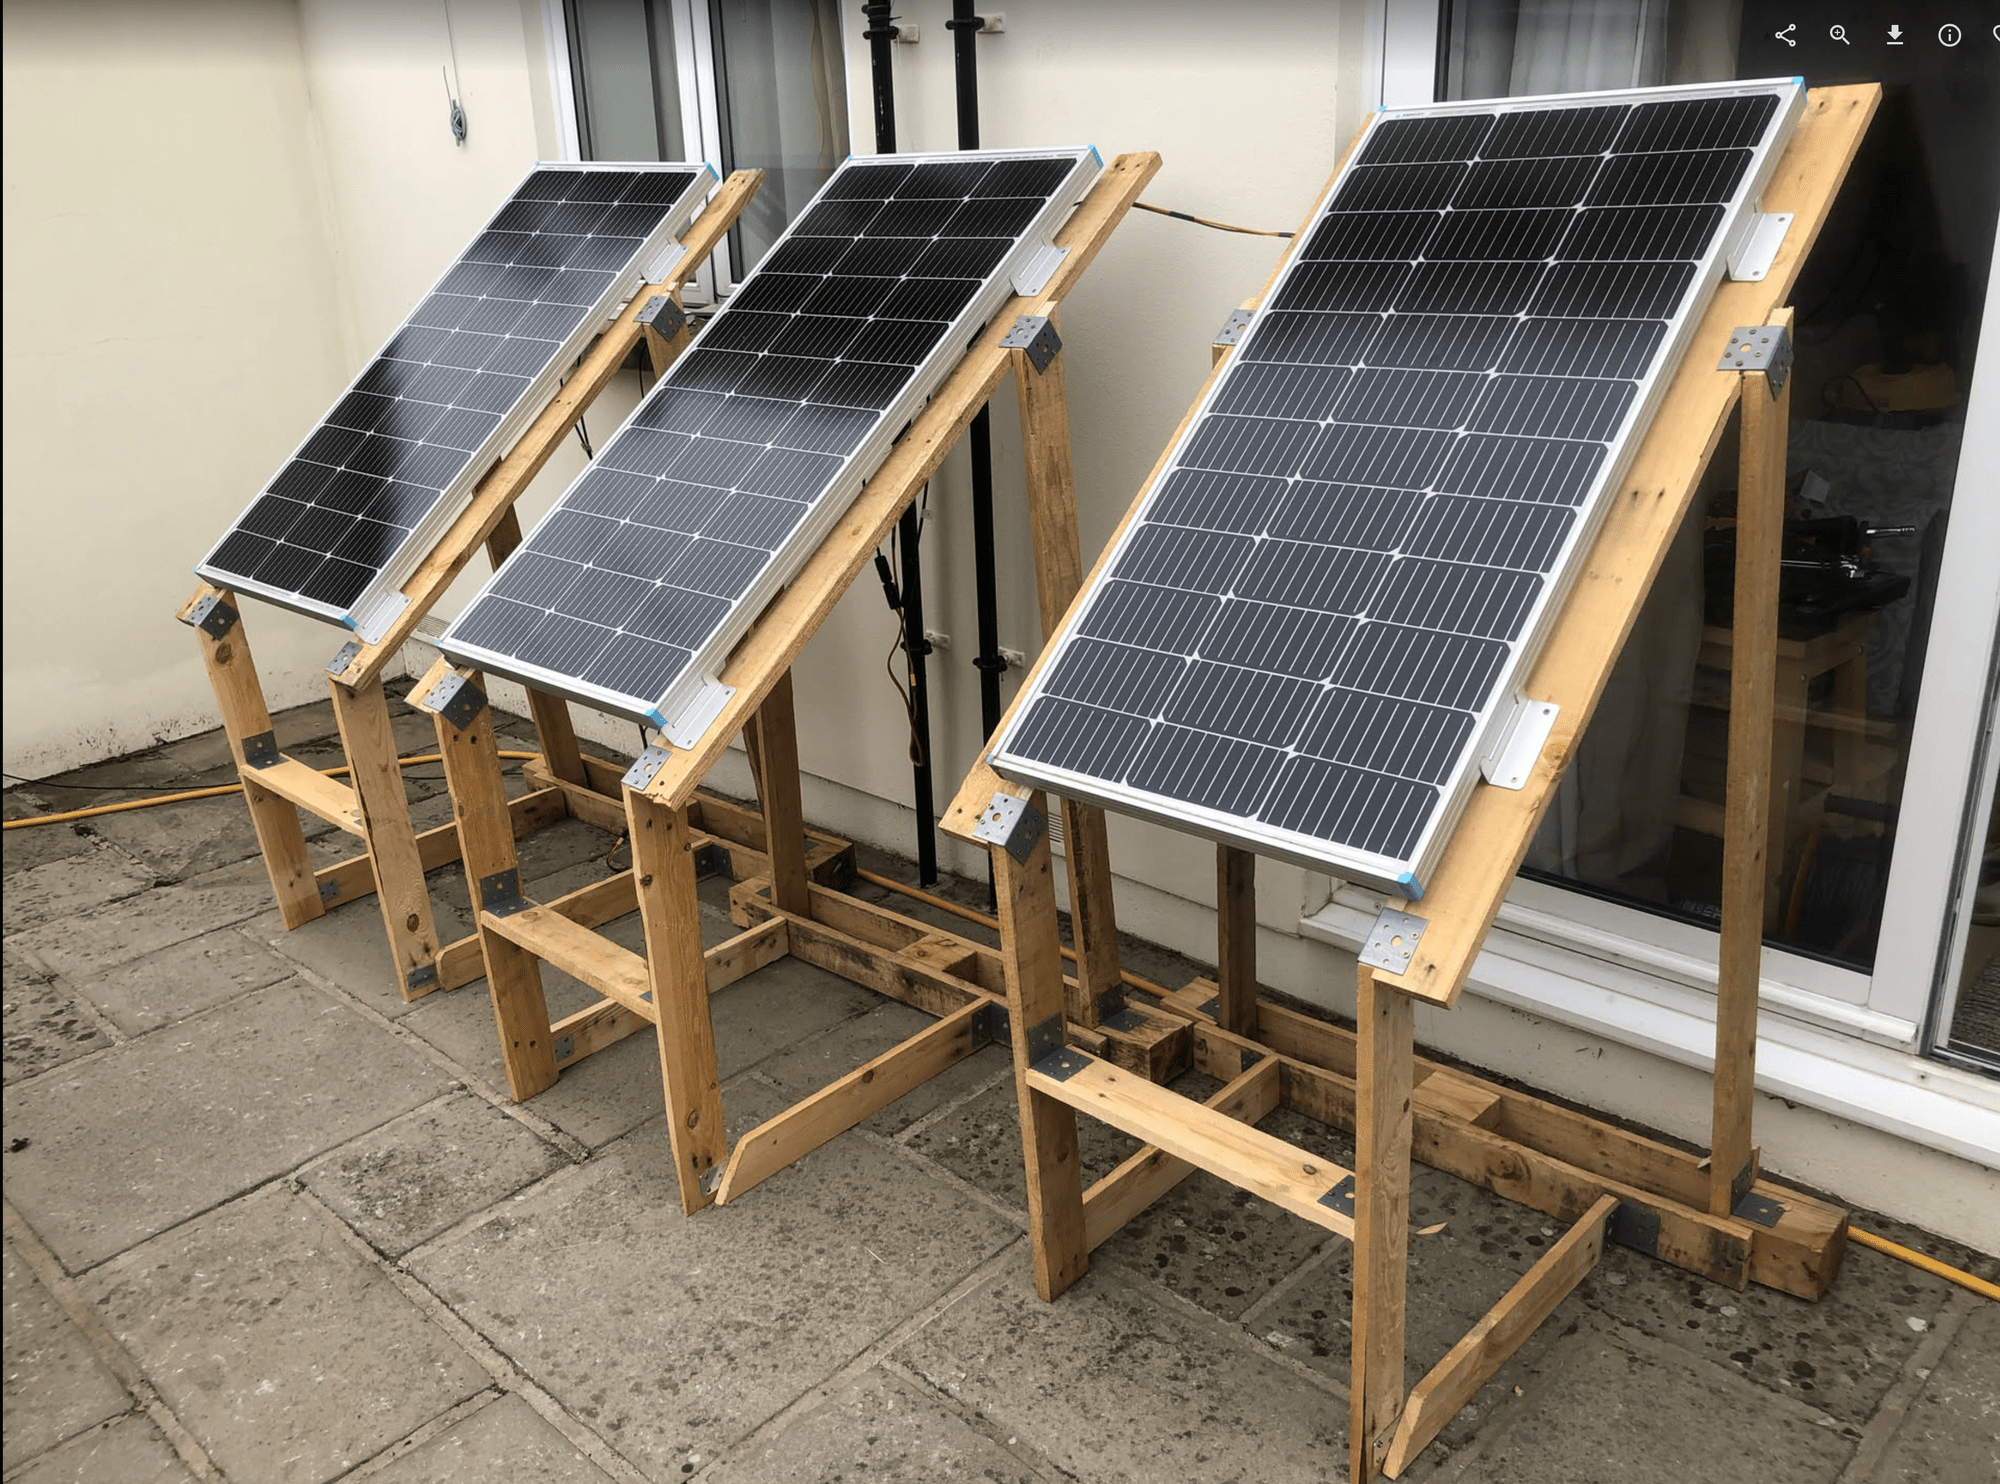
Then I installed the proper system. Four Renogy 100W panels plus two N-type 100W panels giving me 600W total in the garden on wooden frames, a Fogstar 560Ah (6.7kWh) LiFePO4 battery to actually store it all, and a Victron SmartSolar MPPT 100/50 to tie it together, all monitored and automated through Home Assistant. More on how HA runs the system → The solar bar chart shows almost nothing before this point.
From July 2025 onwards the solar bars start appearing for real. August 2025 was around 22 kWh generated. Then — look at this — November 2025 jumped to nearly 38 kWh, and March 2026 is tracking similarly around 35–36 kWh. Even in the darker months the system is pulling meaningful generation. My electricity consumption kWh bars have visibly flattened since the install, and the cost bars are noticeably shorter.
The Fogstar microgrid runs considerably more than the PowerHouse ever did: desk lights, the main television array with set-top boxes, routers, e-bike battery recharges, two micro-PCs running ProxMox 24/7 (one handling Home Assistant, location tracking and image storage; the other running websites — this one included), LED strips behind two poster frames that show the current battery level at a glance, and a cluster of other always-on low-draw devices. Everything is low power — the microgrid base load sits around 120W across all those devices. The wider home grid base — fridge, vampire devices and similar — adds another 38W or so on top. Things like the fridge, oven and kettle stay on the main grid; the microgrid covers the electronics and lighting that run continuously. That split means the Fogstar is rarely asked to do anything heavy, which keeps the daily cycle well within its capacity and means it almost always arrives at the cheap overnight charging window with plenty of room to fill.
What the Solar Actually Saves
On Octopus Agile the average unit rate sits roughly around £0.18–0.22/kWh across the day, with daytime slots often hitting £0.25–0.35/kWh — exactly when the panels are generating. So every kWh I produce is displacing some of the most expensive grid electricity. Using £0.20/kWh as a conservative midpoint:
| Period | Monthly generation | Estimated saving |
|---|---|---|
| August 2025 | ~22 kWh | ~£4.40 |
| November 2025 | ~38 kWh | ~£7.60 |
| March 2026 | ~35 kWh | ~£7.00 |
| Summer peak (projected) | ~90–110 kWh | ~£18–22 |
Annualised across the full cycle of seasons — winter lows, summer highs — a realistic estimate is £120–180/year in electricity avoided. Compare that to the PowerHouse era's ~£3–5/month of marginal load-shifting and the difference is stark. The chart already shows it: electricity cost bars since July 2025 are visibly shorter, not because rates dropped (they haven't, much) but because I'm simply consuming less grid power.
The system cost roughly £1,200–1,500 all in: panels, the Fogstar 560Ah (6.7kWh) battery, the Victron MPPT, wiring and brackets. The direct generation saving is around £120–180/year, giving an 8–10 year payback on paper — not spectacular in isolation. But that framing undersells what is actually happening.
Every kWh the panels generate or the battery stores from a cheap overnight slot is a physical unit of electricity that does not get purchased from the grid. It is not an accounting abstraction — it is a real cost simply not incurred. At typical Agile rates that saving compounds across every charge cycle, every day, across every season.
The bigger saving is harder to quantify but arguably more significant: the battery makes Octopus Agile viable year-round. Without storage, Agile is a risk in winter. A cold snap drives grid demand up, half-hourly rates spike, and with no way to avoid those slots, bills hit £0.40–0.60/kWh during the worst hours. Most households on Agile without storage end up switching to a fixed contract or the price cap for the winter months — and the price cap unit rate has rarely been the bargain it sounds like. With the Fogstar in place, expensive slots are simply ridden out on stored energy. The battery charges during the cheapest overnight hours, covers the evening peak, and the Agile average rate stays low across the whole year. The tariff works the way it is supposed to work.
In practice that means the effective rate paid for electricity — blending solar generation, cheap overnight charging, plunge events and avoided peaks — is well below what any fixed contract or price cap would offer. The HA overview dashboard puts the average rate including solar at around £0.02/kWh on a typical day. That figure speaks for itself. The payback calculation assumes a static £150/year saving. The reality is a system that is actively and continuously optimising against a dynamic tariff — and doing it automatically, without intervention.
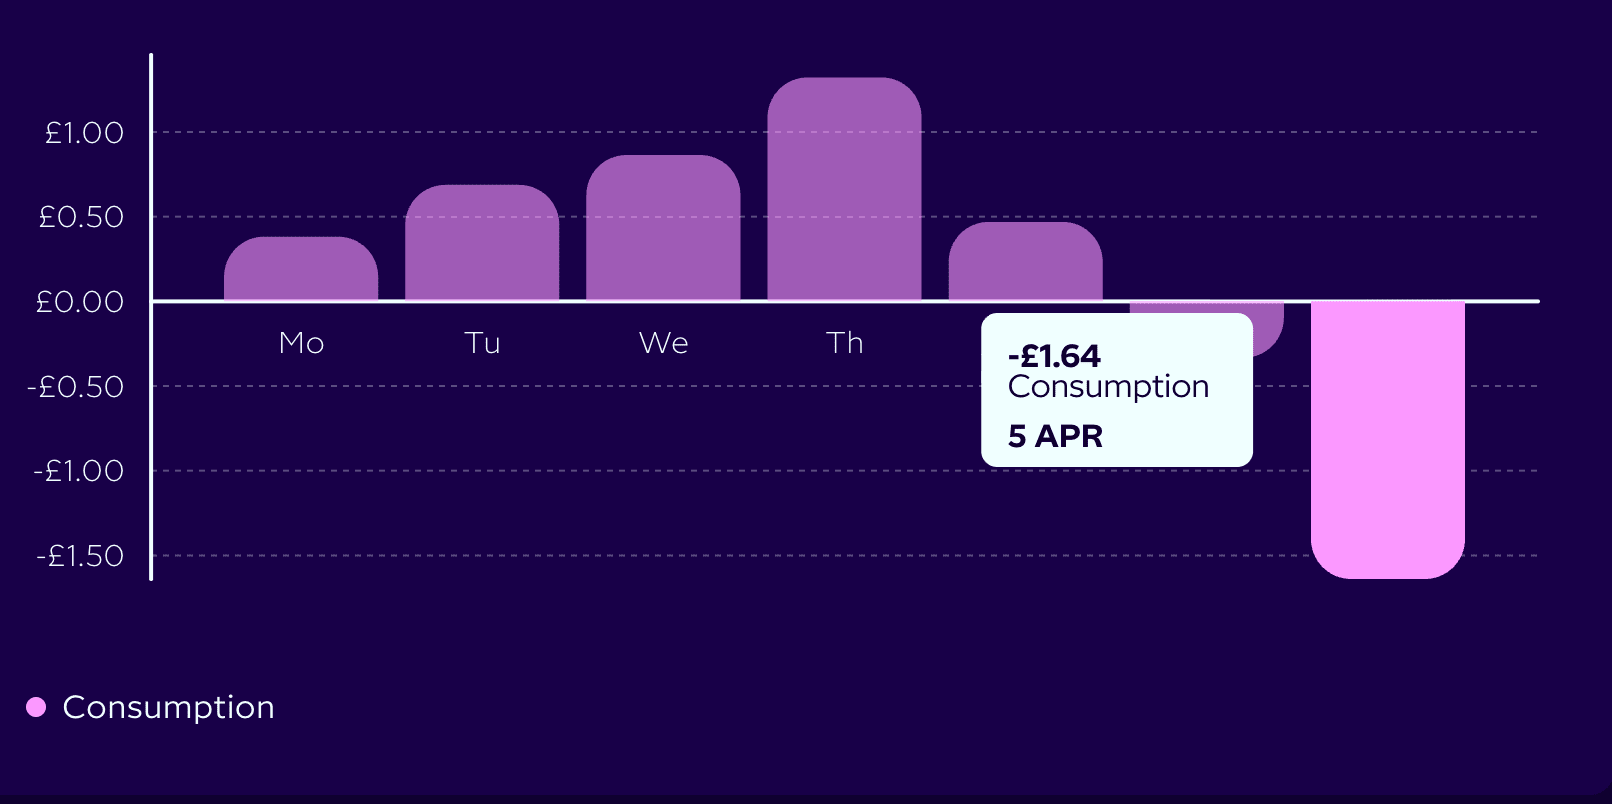
And then there are the days the bill goes negative. On 5 April the daily consumption charge came in at -£1.64 — not a rounding error, not a credit adjustment, just a day where the combination of solar generation, stored cheap overnight energy and a plunge event meant that more value was received from the grid than was paid for it. Days like that have hit -£1.50 and beyond. The standing charge is still a cost — but -£1.64 consumption minus 54p still leaves the day at -£1.10. The whole bill is negative.
The panels pay back in kWh. The battery pays back in flexibility. The bill pays back in minus signs. I really am Agile.
That Quiet Blip in January–February 2026
One funny artefact in the gas data: there's a near-flatline from mid-January to mid-February 2026. That's because I was in India for five weeks. Nobody home, heating completely off. Even the data goes on holiday.
Electricity only dropped about 29% — from 5.9 kWh/day to 4.2 kWh/day. The fridge-freezer was off, but vampire loads take their toll — servers, routers and networking equipment ran continuously throughout. Neither cared that nobody was home.
Mid-winter solar is negligible, so every unit going in came straight from the grid. Each night between 1am and 5am — peak Agile cheap window — the battery charged at around 480W. By 6am it switched to discharging and quietly powered the empty flat through the day. 2.3 kWh in, 2.0 kWh out, every single day.
Reducing those vampire loads is a future project. There’s probably a meaningful saving buried in the always-on baseload that’s never been properly audited.
What Five Years Actually Shows
The energy crisis was real and it hurt. But tracking every number through it meant I understood exactly what was happening and why. The bills during 2022–23 were a genuine shock — combined electricity and gas regularly hitting £100–115/month at the peak — and there was nothing clever I could do about it except watch and record. The PowerHouse experiment was a response to that helplessness, even if its actual financial impact was negligible. The solar system was the real response.
The numbers across three eras tell the story cleanly:
| Era | Electricity (monthly) | Gas (monthly) | Solar saving |
|---|---|---|---|
| Pre-crisis (2021–22) | ~£25–35 | ~£15–25 | None |
| Crisis peak (winter 2022–23) | ~£50–65 | ~£45–50 | None |
| Post-crisis plateau (2023–mid 2025) | ~£25–40 | ~£15–30 | ~£3–5 (PowerHouse, load-shift only) |
| Solar era (Jul 2025–now) | ~£15–25 | ~£15–30 | ~£10–22/month depending on season |
The Price Comparisons
Two benchmarks are worth looking at. The Energy Price Guarantee (Oct 2022–Jun 2023) was the government's emergency cap that held typical electricity at ~34–36p/kWh while the Ofgem cap was heading toward 52–67p. The Ofgem price cap has been in place since 2019 and provides a useful baseline for the full period. Both are hypothetical comparisons against what a default tariff customer would have paid.
Both use approximately 200 kWh/month electricity consumption.
Energy Price Guarantee (Oct 2022–Jun 2023)
| Period | Duration | EPG rate | EPG bill/mo | Actual (Go) | Saving/mo |
|---|---|---|---|---|---|
| Oct 2022–Mar 2023 | 6 months | ~34p/kWh | ~£68 | ~£40–50 | ~£18–28 |
| Apr–Jun 2023 | 3 months | ~36p/kWh | ~£72 | ~£45–55 | ~£17–27 |
Rough saving across the EPG period: approximately £160–230.
Vs Ofgem Price Cap — Full Period
| Period | Tariff | Cap rate | Cap bill/mo | Actual bill/mo | Saving/mo |
|---|---|---|---|---|---|
| Nov 2021–Sep 2022 | Go | 20.8–28.3p | ~£42–57 | ~£28–40 | ~£12–17 |
| Oct 2022–Jun 2023 | Go | ~34–36p (EPG) | ~£68–72 | ~£40–55 | ~£17–28 |
| Jul 2023–Mar 2024 | Go Variable | 27–30p | ~£54–60 | ~£40–50 | ~£10–14 |
| Mar 2024–Jul 2025 | Agile / Cosy | 24.5–27p | ~£49–54 | ~£28–35 | ~£15–22 |
| Jul 2025–Mar 2026 | Agile + solar | 25.7–27.7p | ~£51–55 | ~£12–18 | ~£33–43 |
Rough total over 53 months: approximately £750–1,050 saved against what a price cap customer would have paid. Excludes plunge events, the April 2026 green levy reduction, and peak avoidance.
The Undocumented Saving: Peak Avoidance
The table above captures the difference in average rates. What it does not capture is what the battery actively prevents: buying electricity during the evening peak.
On Octopus Agile the 4pm–7pm window regularly runs at £0.30–0.50/kWh, and during cold high-demand evenings in winter can spike well above £0.60/kWh. A price cap customer pays the same flat rate regardless of the time. An Agile customer without storage has no choice — whatever the half-hourly slot costs, they pay it. With the Fogstar in place, the battery covers the evening peak entirely. It charges overnight at £0.05–0.10/kWh and discharges through those expensive hours without drawing a single unit from the grid at peak rates.
A typical evening shift of 2–3 kWh moves from £0.35–0.50/kWh peak slots to £0.07/kWh overnight storage. That is a saving of around £0.56–1.29 per evening — roughly £17–39/month of pure peak-shifting value, on top of everything else. None of this shows up in a standard payback calculation. The battery is not just storing solar energy. It is actively navigating a dynamic tariff every single day, without being asked.
Agile Pricing and Why the Tariff Matters
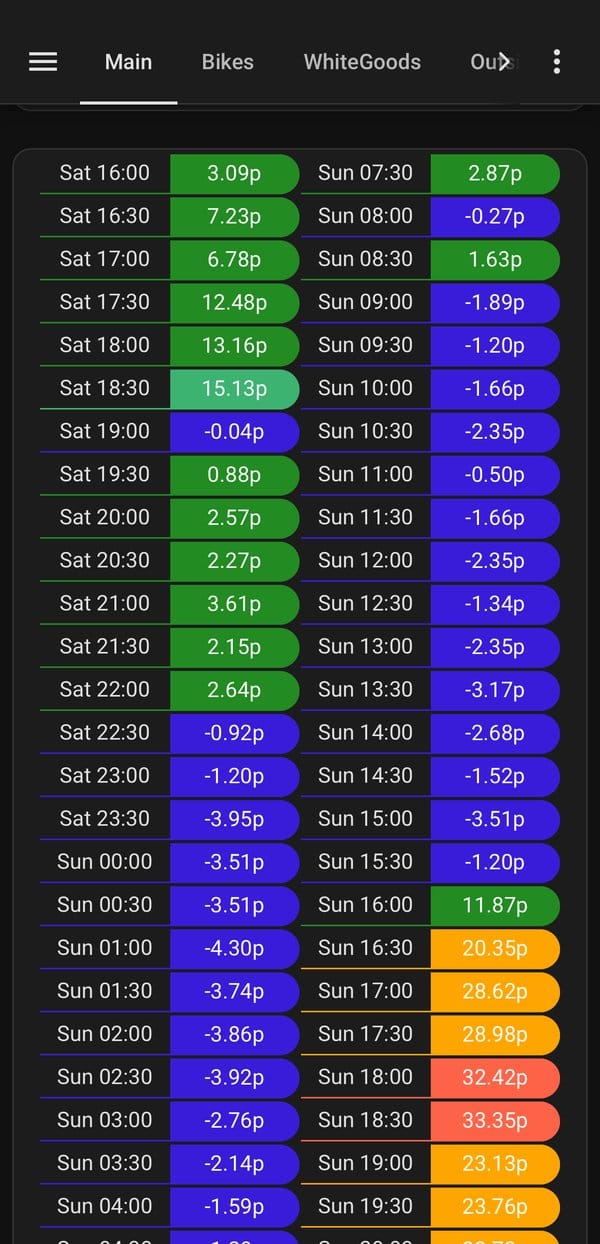
Running on Octopus Agile means the unit rate changes every 30 minutes, tracking the wholesale electricity market. Most of the time that means paying somewhere between £0.10 and £0.35/kWh depending on the time of day, though the tariff has a hard cap of 100p/kWh — a ceiling that does get hit during extreme demand events, and has been seen here firsthand. But occasionally the opposite happens — the grid gets overwhelmed with too much wind or solar generation and not enough demand — and the wholesale price goes negative. Agile passes that straight through. The grid pays to consume electricity.
That screenshot is from a recent plunge event. The blue negative numbers are slots where the rate dropped below zero — as low as -4.30p/kWh at one point. The system was running off the grid for free and getting credited for it. Any surplus solar generation during a plunge is effectively double good: the panels are producing and the grid pays to take more on top.
From April 2026 the economics got a little better still. The Government removed the green levies that had been bundled into electricity bills, resulting in roughly a 3.5p/kWh reduction in the Agile base rate. That does not sound dramatic but across 100 kWh of monthly consumption it is £3.50 off the bill — and it compounds with every plunge event and every kWh the panels produce. The floor just got lower.
Where This Goes Next
April through June is where the system should start to shine properly. Day length goes from around 13 hours at the start of April to nearly 17 hours by midsummer, and the sun angle improves significantly. March was already generating 35+ kWh on panels that are south-facing but ground-mounted at a fixed angle — summer could plausibly push 90–120 kWh/month. If it does, electricity bills could drop to near zero for several months running.
Beyond that, the obvious next step would be adding more panel capacity. The Victron MPPT 100/50 can handle up to 700W on a 12V system without breaking a sweat, so there's a small amount of headroom even now. A second array or higher-wattage panels would push summer generation higher and extend the shoulder seasons. The Fogstar battery at 560Ah (6.7kWh) already has more than enough storage to absorb a good day's generation — the bottleneck is the input, not the tank.
Update — 30 April 2026: Just added a 7th panel (£55.24 panel + £7.99 bracket). The array is now 700W — right on the Victron MPPT 100/50's design ceiling. The total investment ticks to £2,083, and from May the daily yield curve should step up another ~14% on cloudless days.

Energy prices are unlikely to stay calm forever. The chart shows two distinct crisis spikes already in five years of data. Having generation and storage in place before the next one matters more than the payback spreadsheet. The data made me do it the first time. It'll make me expand it next time too.
If you’re on or considering Octopus Energy, the referral link is share.octopus.energy/crisp-bee-8 — both of us get a bill credit.
† Full Octopus tariff history
| From | To | Tariff |
|---|---|---|
| Sep 2021 | Sep 2022 | Octopus Go (GO-21-05-13) |
| Sep 2022 | Sep 2023 | Octopus Go (GO-22-07-05) |
| Sep 2023 | Mar 2024 | Octopus Go Variable (GO-VAR-22-10-14) |
| Mar 2024 | Jan 2025 | Octopus Agile (AGILE-23-12-06) |
| Jan 2025 | Apr 2025 | Octopus Cosy — with brief Agile intervals |
| Apr 2025 | Aug 2025 | Octopus Agile (AGILE-24-10-01) |
| Aug 2025 | Feb 2026 | Octopus Agile (brief Cosy dip Aug 11–14) |
| Feb 2026 | Mar 2026 | Octopus Go Variable / Agile (switching) |
| Mar 2026 | Mar 2027 | Octopus Agile (AGILE-24-10-01) |
Source: Octopus Energy API, account agreements endpoint. Retrieved April 2026.
Standing charges — electricity & gas, all tariffs (inc. VAT, direct debit rates)
| Tariff | SC valid from | SC valid to | Standing charge |
|---|---|---|---|
| Electricity | |||
| Variable (VAR-21-07-02) | Jul 2021 | Apr 2022 | 24.03p/day |
| Go (GO-21-05-13) | May 2021 | — | 25.00p/day |
| Go (GO-22-07-05) | Jul 2022 | — | 41.39p/day |
| Go Variable (GO-VAR-22-10-14) | Mar 2023 | Mar 2024 | 45.57p/day |
| Agile (AGILE-23-12-06) | Dec 2023 | — | 45.56p/day |
| Cosy (COSY-22-12-08) | Oct 2024 | Mar 2025 | 55.79p/day |
| Cosy (COSY-22-12-08) | Apr 2025 | Jun 2025 | 46.98p/day |
| Cosy (COSY-22-12-08) | Jul 2025 | Sep 2025 | 44.78p/day |
| Agile (AGILE-24-10-01) | Oct 2024 | — | 55.79p/day |
| Go Variable (GO-VAR-22-10-14) | Jan 2026 | Mar 2026 | 47.76p/day |
| Go Variable (GO-VAR-26-02-11) | Feb 2026 | Mar 2026 | 47.76p/day |
| Gas | |||
| Variable (VAR-21-07-02) | Jul 2021 | Apr 2022 | 23.85p/day |
| Variable (VAR-21-07-02) | Apr 2022 | Sep 2022 | 27.22p/day |
| Variable (VAR-21-07-02) | Sep 2022 | Mar 2023 | 26.84p/day |
| Variable (VAR-22-11-01) | Mar 2023 | Jan 2024 | 27.47p/day |
| Variable (VAR-22-11-01) | Jan 2024 | Mar 2024 | 27.47p/day |
| Silver (SILVER-23-12-06) | Dec 2023 | — | 27.47p/day |
| Variable (VAR-22-11-01) | Oct 2024 | Mar 2025 | 29.34p/day |
| Variable (VAR-22-11-01) | Apr 2025 | Jun 2025 | 31.07p/day |
| Variable (VAR-22-11-01) | Jul 2025 | Sep 2025 | 28.59p/day |
| Silver (SILVER-25-09-02) | Sep 2025 | — | 32.64p/day |
Source: Octopus Energy API, standing-charges endpoint. Direct debit rates. Retrieved April 2026.