What a year to look back on. I've been obsessively tracking every kilowatt-hour in and out of the system, and when I lay the whole of 2025 out in charts, the story basically tells itself.
January to June: Flying Blind (Electrically Speaking)
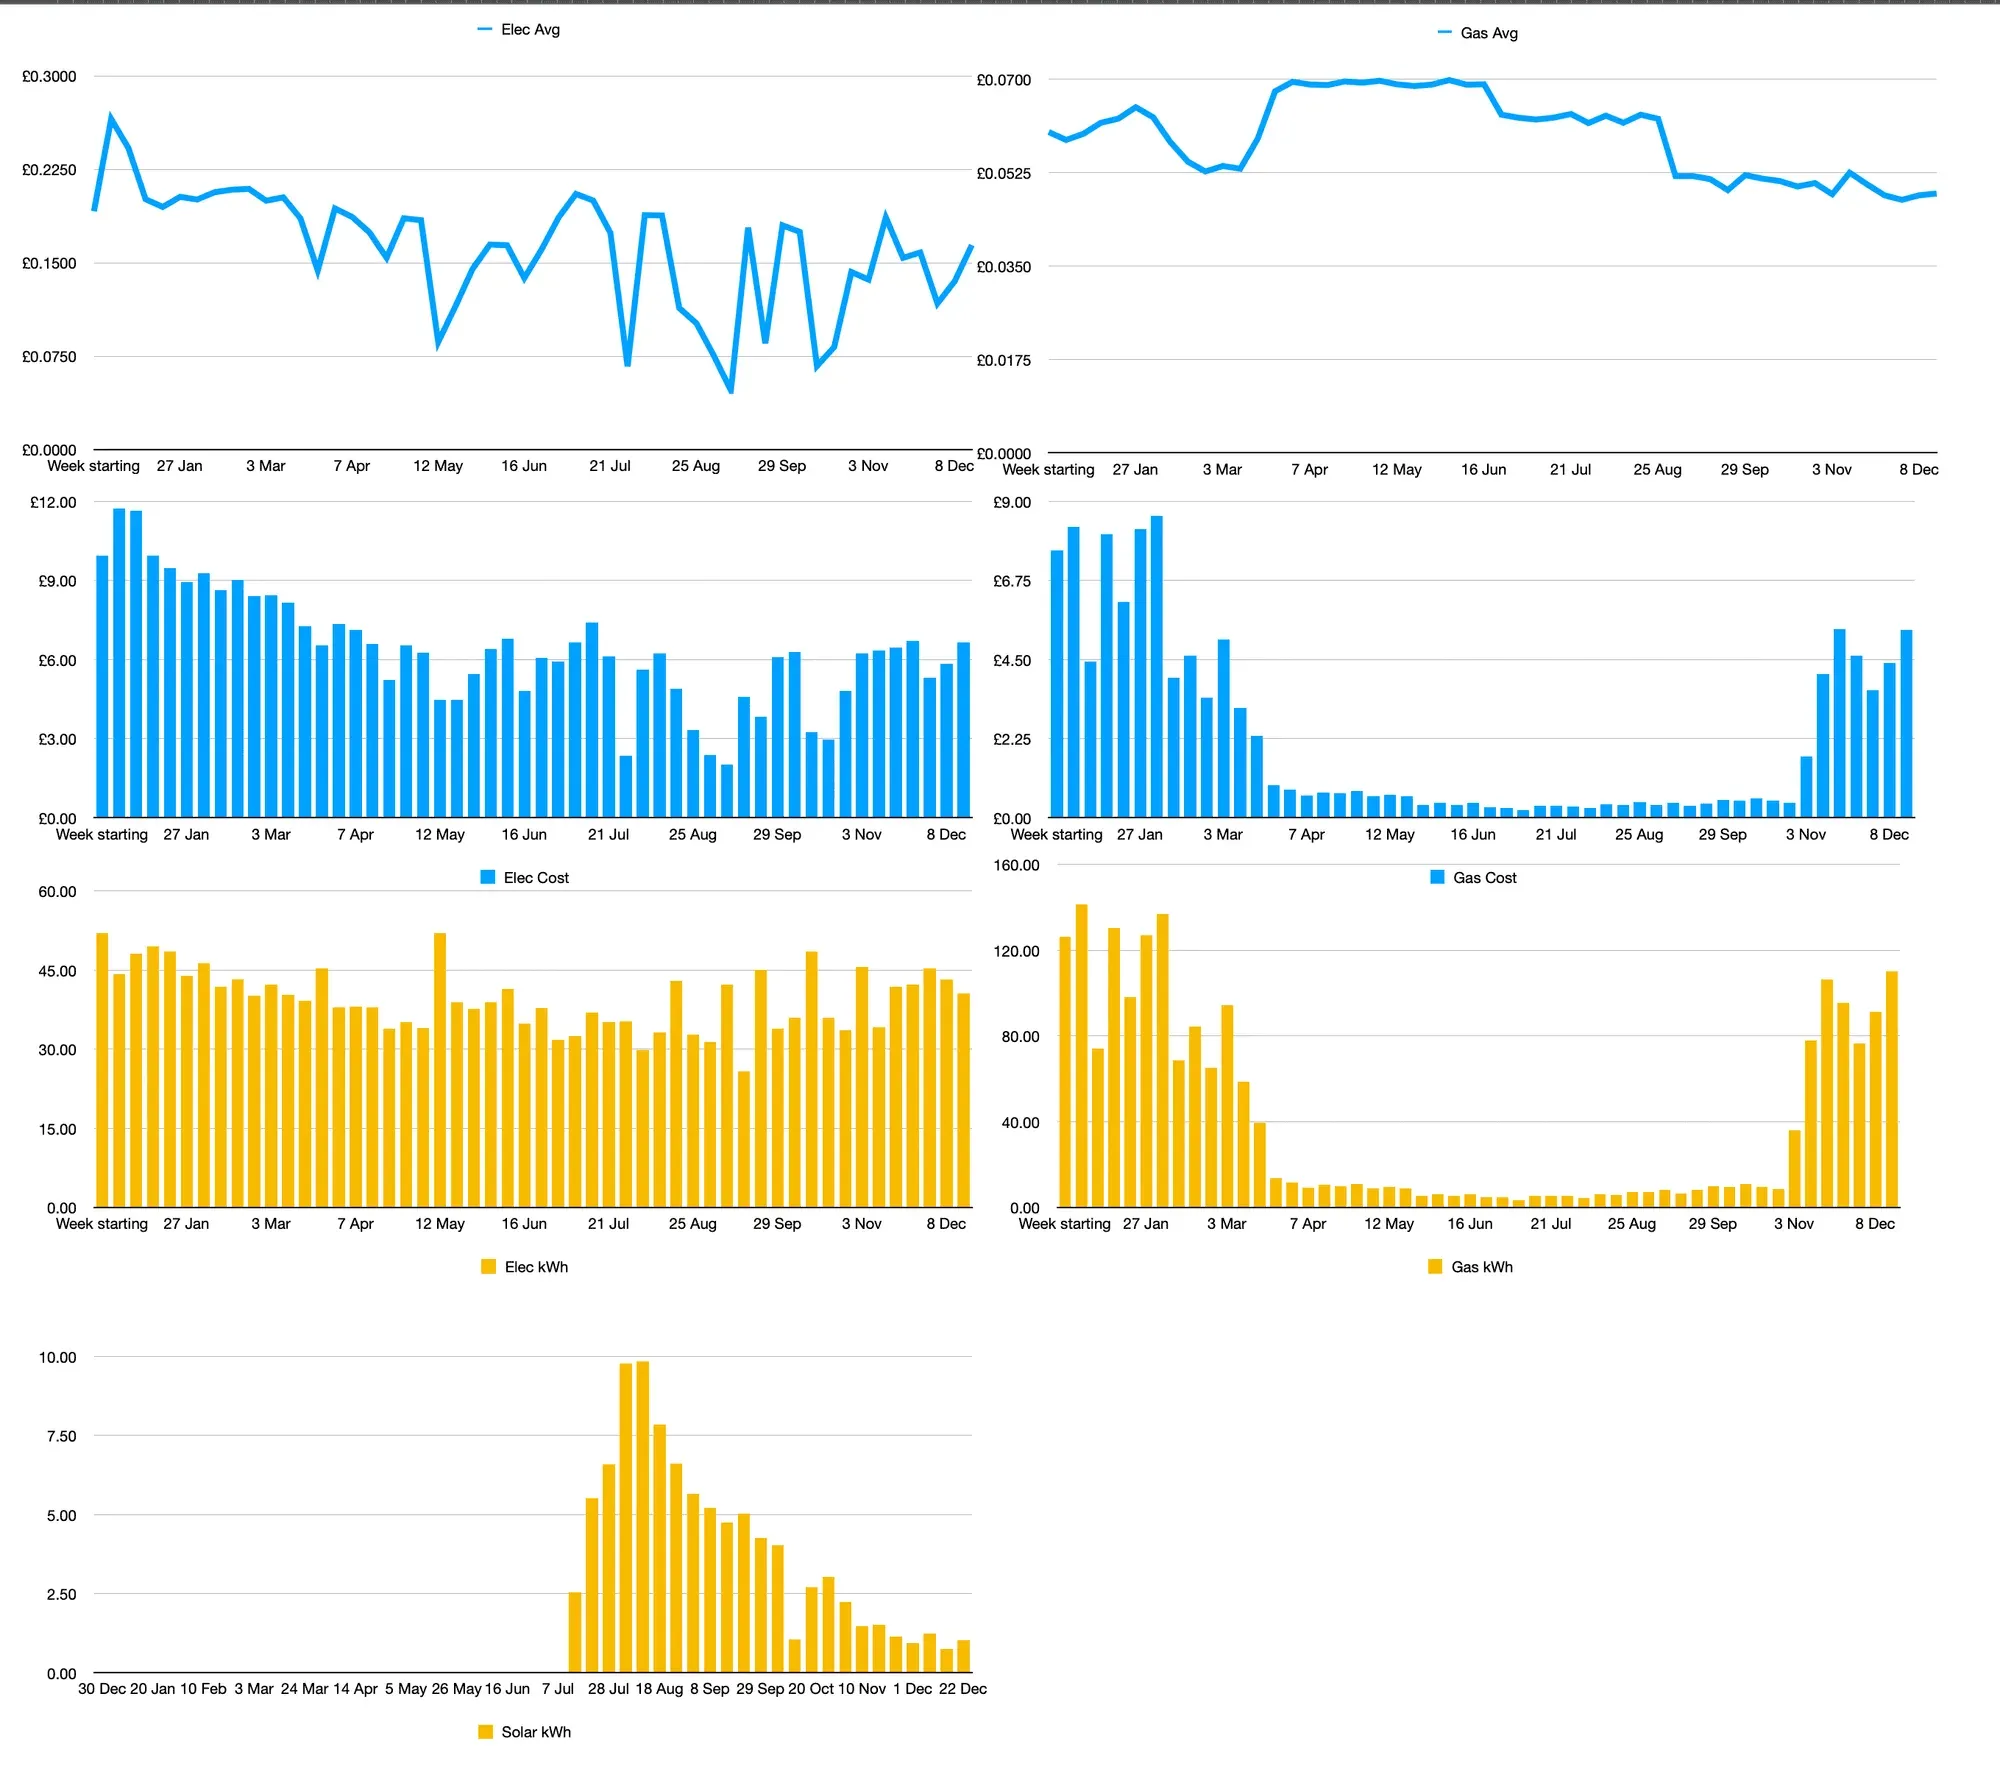
The first half of the year was just… normal. Paying whatever the grid wanted to charge me. The electricity rate chart shows that I started January paying around £0.28/kWh — ouch — before it settled into the £0.20–0.22 range for most of spring. My weekly electricity bills were consistently £6–£10, hitting nearly £12 in that first week of January. Gas was doing its own thing, costing me £7–£8 a week through the cold months with usage up around 120–130 kWh per week.
I did have a tiny 1.2kWh battery kicking around before July, but honestly it barely registers in the data. It was more of a curiosity than a solution.
July: The Real System Arrives
This is the moment everything changed. In July I installed 4x Renogy 100W panels, a Fogstar 560Ah LiFePO4 battery, and a Victron SmartSolar MPPT 100/50. Suddenly I had a proper 400W solar setup and — look at that solar chart — the generation just explodes. Peak weeks in late July and August hit nearly 10 kWh, with multiple weeks sitting comfortably at 7–8 kWh. That's real, usable energy offset from a system that cost me a one-time outlay rather than a monthly direct debit.
The electricity cost chart shows the effect pretty clearly. Those August and September weeks where I'm spending £2–£3 on electricity? That's the solar doing its job. Compare that to the £6–£10 I was spending every single week before July.
23 November: Six Panels and Feeling Smug About It
Just as the sun started getting stingy, I added two N-type 100W panels on the 23rd of November, bringing the total to 600W peak. It felt like exactly the right moment — a little pre-winter confidence boost. The solar generation does tail off into December (it drops to under 1 kWh some weeks), but even squeezing out an extra 20–30% capacity matters when daylight hours are precious.
The Six-Month Comparison
Jan–June: zero meaningful solar generation, electricity costs averaging £6–£8/week, total probably around £180–£200 for the half year just on electricity.
Jul–Dec: solar kicking in, costs regularly dipping to £3–£5/week through summer and autumn, only creeping back up toward £5–£6 as December arrives. The saving across those six months is easily £50–£80 — and that's before accounting for the battery's ability to shift cheap overnight power.
I'm genuinely excited to see what a full year with the 600W system looks like. The data nerd in me cannot wait.