 elyob
Every one of my twenty best solar days landed between 1 May and 11 August 2026, and all twenty came in at 3.32 kWh or more. July alone claimed 12 of them. The best of the lot was 27 July: 3.54 kWh from a 700-watt array sitting on pallet frames in the garden.
Summer was the whole story. Through the dead of winter the panels limped along: December averaged 0.15 kWh a day and January 0.23. By April that had climbed to 2.06, then May 2.26 and June 2.40, before July peaked at 2.90.
August held 2.49 kWh a day. September has averaged 1.61 so far, the autumn turn already showing.
Days above 3 kWh are the ones I watch for. There have been 49 of them, the first on 23 April and the most recent on 5 September. Since the array reached full size at the end of April it has averaged 2.34 kWh a day, against 1.33 across the whole record, which the winter months drag right down.
Two things got me here, at opposite ends of the cold. I added a pair of N-type panels on 23 November 2025, straight into the darkest weeks, so they did almost nothing at first and I took the upgrade on faith. The seventh panel went up on 30 April 2026, just as the days were stretching out.
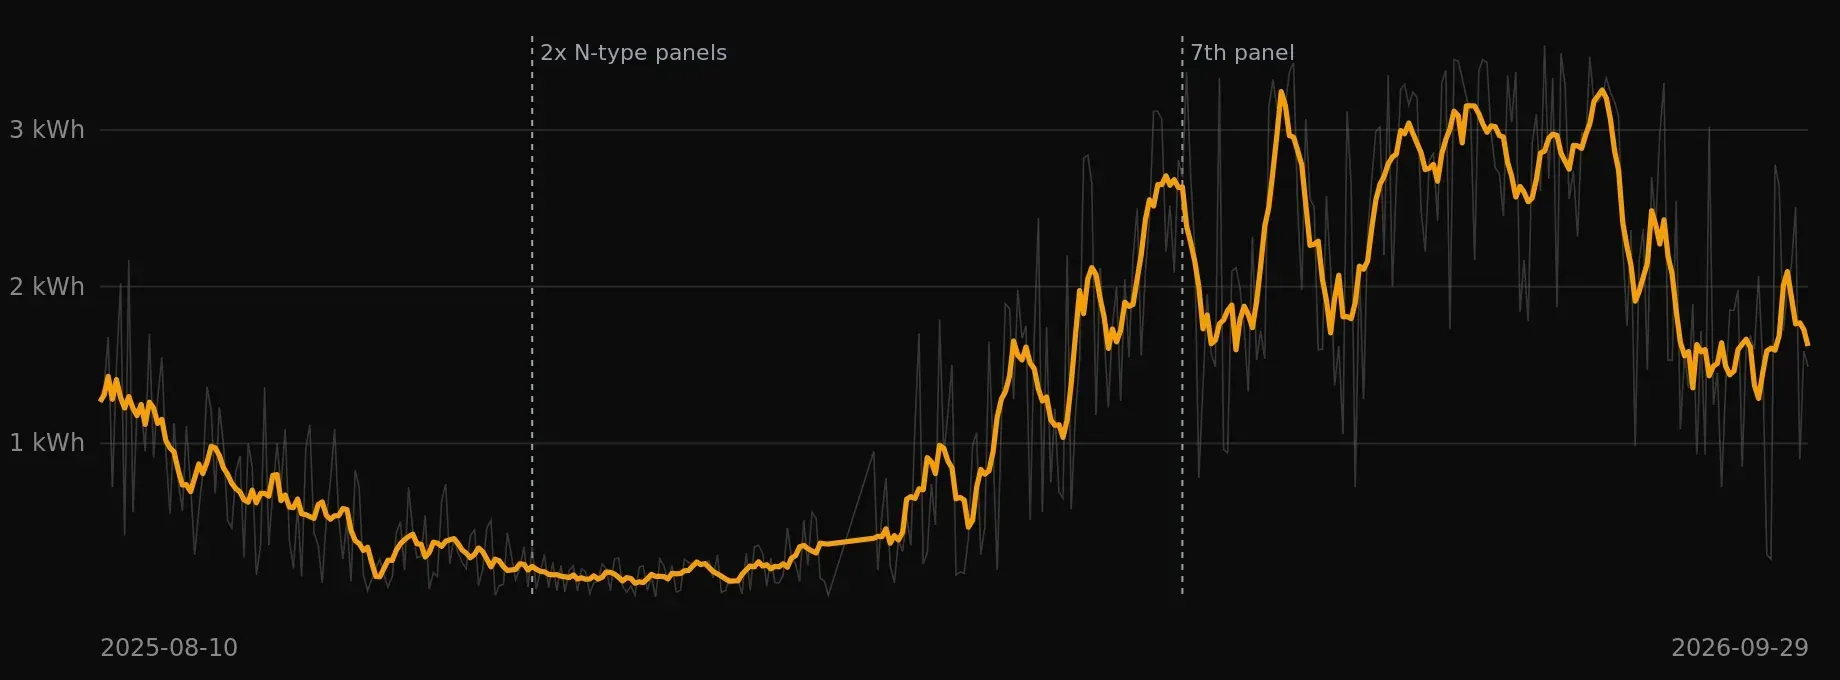

The line graph shows the whole arc: a late-summer 2025 start, a long slide into a near-flat winter trough, a steep climb from March, a July peak, and the turn into autumn. The contribution grid is the bit I keep staring at, dim and sparse in December and dense, bright amber through the summer.
These are the corrected daily figures. In September a fix to how each day's total is settled removed days where the meter had carried over the previous day's total, and restored a few that had been wrongly recorded as zero. One day left the top twenty: 2 May, which had carried over 1 May's 3.37 kWh and really made 2.72.
None of this is going to power the flat. It's a 700-watt array on salvaged frames at ground level, and on its best day it brushes a ceiling the single charge controller imposes. That's not the point. The grid filled in, the line climbed, and a thing I bolted together in a garden keeps turning daylight into something useful.
The Top 20
| # | Date | Yield |
|---|---|---|
| 1 | 27 Jul 2026 | 3.54 kWh |
| 2 | 31 Jul 2026 | 3.49 kWh |
| 3 | 7 Aug 2026 | 3.47 kWh |
| 4 | 5 Jul 2026 | 3.45 kWh |
| 5 | 12 Jul 2026 | 3.45 kWh |
| 6 | 6 Jul 2026 | 3.44 kWh |
| 7 | 27 May 2026 | 3.43 kWh |
| 8 | 13 Jul 2026 | 3.43 kWh |
| 9 | 3 Jul 2026 | 3.38 kWh |
| 10 | 11 Jul 2026 | 3.38 kWh |
| 11 | 1 May 2026 | 3.37 kWh |
| 12 | 26 May 2026 | 3.37 kWh |
| 13 | 20 Jul 2026 | 3.37 kWh |
| 14 | 19 Jun 2026 | 3.35 kWh |
| 15 | 18 Jul 2026 | 3.35 kWh |
| 16 | 9 May 2026 | 3.33 kWh |
| 17 | 7 Jul 2026 | 3.33 kWh |
| 18 | 29 Jul 2026 | 3.33 kWh |
| 19 | 11 Aug 2026 | 3.33 kWh |
| 20 | 22 May 2026 | 3.32 kWh |