 elyob
elyob
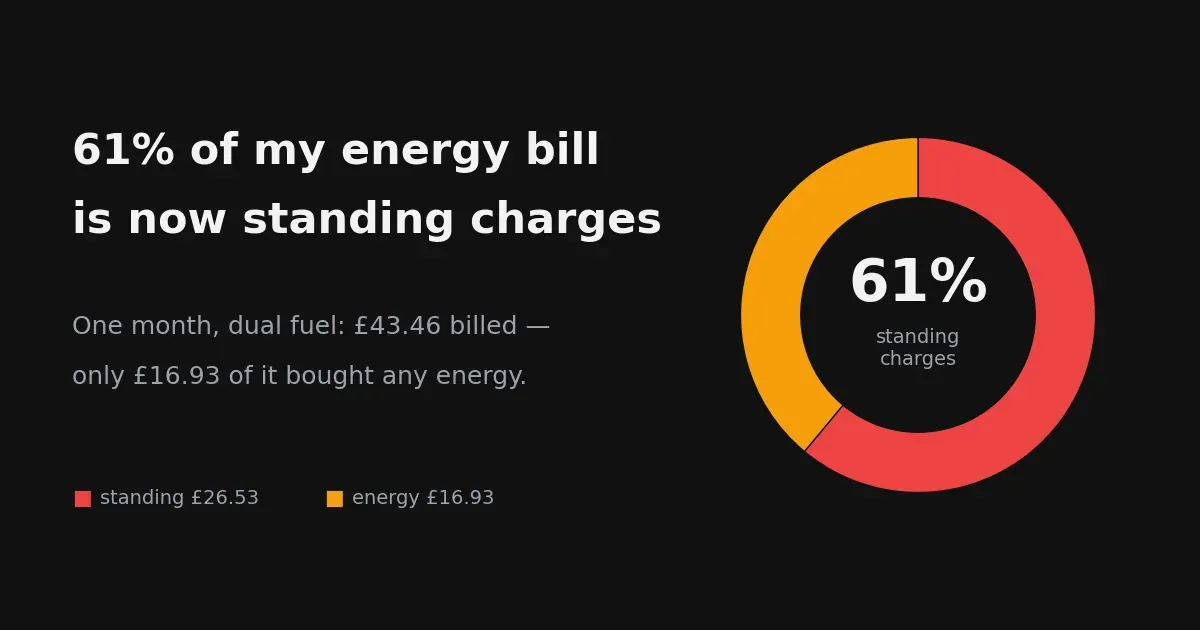
My latest Octopus statement (11 June – 10 July) says they charged me £43.46 for a month of dual-fuel energy. Sounds fine — until you look at what that money actually bought.
| Component | Amount | % of bill |
|---|---|---|
| Electricity standing charge (30 × 55.79p) | £16.74 | 38.5% |
| Gas standing charge (30 × 32.64p) | £9.79 | 22.5% |
| Total standing charges | £26.53 | 61% |
| Electricity I actually used | £16.39 | 37.7% |
| Gas I actually used | ~£0.54 | ~1.2% |
61% of my energy bill is now standing charges. I paid £26.53 for the privilege of having two meters, and £16.93 for every unit of energy I consumed in a month.
This is what happens when the charge planner does its job too well. Solar covers the daytime. The battery charges in the cheapest half-hour slots — sometimes at negative prices, where Octopus pays me to charge — and carries the house through the expensive evening peaks. Consumption cost gets squeezed and squeezed… and what’s left standing is the one line item no optimiser can touch: the fixed daily fee.
The electricity side I’ll accept — 55.79p/day buys a grid connection that I actively arbitrage against. The gas line is harder to defend: £9.79 a month of standing charge to burn 54p of gas. The boiler is basically a winter appliance; in summer I’m paying an 18:1 ratio of fee to fuel.
The uncomfortable arithmetic for the industry: as more homes get solar, batteries and smart tariffs, bills increasingly become subscriptions with a rounding error of energy on top. The optimisation that regulators say they want us doing makes the fixed fee the whole bill.
How it changes through the year
That 61% is a summer number. Pulling every half-hour of consumption from the last twelve months out of the planner’s database, here’s the electricity-only standing share, month by month:
| Month | kWh | Usage | Standing | Standing % |
|---|---|---|---|---|
| Aug 25 | 158 | £21.61 | £13.88 | 39% |
| Sep 25 | 142 | £14.13 | £13.43 | 49% |
| Oct 25 | 179 | £19.80 | £14.59 | 42% |
| Nov 25 | 185 | £28.28 | £14.12 | 33% |
| Dec 25 | 191 | £27.93 | £14.59 | 34% |
| Jan 26 | 158 | £29.57 | £14.81 | 33% |
| Feb 26 | 128 | £18.24 | £13.37 | 42% |
| Mar 26 | 176 | £24.48 | £14.81 | 38% |
| Apr 26 | 223 | £8.73 | £15.83 | 64% |
| May 26 | 131 | £25.34 | £16.88 | 40% |
| Jun 26 | 144 | £17.49 | £16.34 | 48% |
Two things jump out. Even in the depths of winter — battery working hardest, days shortest — the standing charge never drops below a third of the electricity bill. And April 2026 is the punchline: the sunniest month used the most electricity (223 kWh) at the lowest cost (£8.73 — under 4p/kWh average, thanks to plunge charging), driving the standing share to 64%. The better the month, the more the bill is just the fee.
Meanwhile the planner keeps grinding: this month it charged 1,042 kWh into the battery at an effective 11.69p/kWh lifetime average, and the account is still £42.94 in credit.