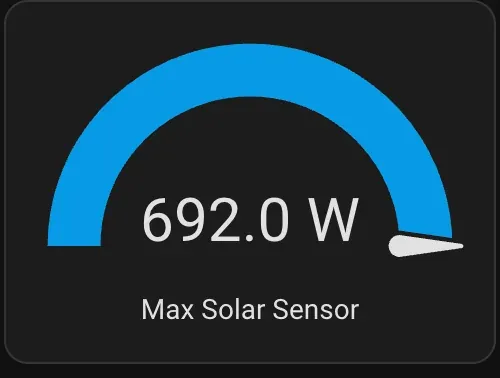
My solar array is rated at 600W. This afternoon it produced 692W — nearly 100W over the nameplate figure. Three of the last eight days have gone above 600W. That's not a sensor glitch. It's physics. Here's what's actually happening, and what it means for whether the array could be expanded further.
What a Panel's Wattage Rating Actually Means
A 100W solar panel doesn't produce 100W in the garden. It produces 100W under Standard Test Conditions (STC):
- Irradiance: exactly 1,000 W/m² — the equivalent of bright noon sun on a clear day
- Cell temperature: exactly 25°C — not air temperature, the silicon itself
- Spectrum: AM1.5 (sunlight filtered through 1.5 atmospheres of air, the angle of the sun at around 48° above the horizon)
STC is a laboratory benchmark for comparing panels from different manufacturers, not a prediction of real-world output. Real conditions deviate from STC in ways that can go either direction — but on a cool spring day with broken cloud cover, they tend to go up.
The Array: What's Actually in the Garden
The array is made up of two panel types, six panels in total:
4× Renogy 100W 12V Mono (original)
| Spec | Value |
|---|---|
| Rated power (Pmax) | 100W |
| Open-circuit voltage (Voc) | 22.5V |
| Max power voltage (Vmp) | 18.9V |
| Short-circuit current (Isc) | 5.75A |
| Max power current (Imp) | 5.29A |
2× Renogy 100W N-Type (16BB)
| Spec | Value |
|---|---|
| Rated power (Pmax) | 100W |
| Open-circuit voltage (Voc) | 22.79V |
| Max power voltage (Vmp) | 19.97V |
| Short-circuit current (Isc) | 5.31A |
| Max power current (Imp) | 5.01A |
A quick note on what those specs mean:
Voc (open-circuit voltage) is the voltage across the panel when nothing is connected. It's the highest voltage the panel will ever produce — useful for checking safety limits. Voc increases as panels get colder, so system design always uses cold-weather worst-case values, not the rated figure.
Vmp (voltage at maximum power) is the voltage at which the panel operates when delivering its peak rated power. Lower than Voc because connecting a load pulls the voltage down from that theoretical maximum. The charge controller continuously tracks this point.
Isc (short-circuit current) is the maximum current the panel can produce, measured when terminals are shorted. Used primarily for fuse sizing.
Imp (current at maximum power) is the current flowing when the panel is operating at Vmp — what's actually happening under normal conditions.
Total rated capacity: 6 × 100W = 600W.
How the Panels Are Wired
All six panels are wired in parallel, each connected individually to a busbar. In parallel wiring, every panel shares the same positive and negative rails — currents from each panel add together, while voltage stays the same as a single panel.
Parallel wiring connects panels positive-to-positive, negative-to-negative. Currents add; voltage stays at single-panel level.
Series wiring (not used here) chains panels positive-to-negative. Voltages add; current stays at single-panel level.
With all six in parallel, the combined figures going into the charge controller are:
- Voc: ~22.79V (the highest individual panel Voc — single panel level, not multiplied)
- Imp: 4 × 5.29A + 2 × 5.01A = 31.18A
- Rated power: 600W
The cold-weather voltage check is straightforward with parallel wiring — it's just a single panel's Voc at the coldest likely temperature. At −10°C, the N-Type panel's Voc rises to around 25.2V. Well within the controller's 100V input limit.
The two panel types have slightly different Vmp values — the voltage at which each type delivers peak power. The mono panels prefer 18.9V; the N-Type panels prefer 19.97V. With both types on the same parallel bus, the charge controller tracks a single operating voltage for the whole array. It will find a compromise point between the two, meaning neither type operates at its exact ideal voltage. The 5.7% gap between them is small enough that the efficiency loss is minor in practice.
Reason One: Temperature
Silicon converts light to electricity less efficiently as it heats up. The temperature coefficient of power for modern monocrystalline panels is typically around −0.35% to −0.44% per °C. STC sets the baseline at 25°C cell temperature — not ambient.
Under full sun, panels typically run 20–30°C hotter than the air around them. So the 25°C STC cell temperature corresponds to roughly a 0–5°C ambient day — a cold winter noon in the UK.
In April, with a cool morning and a breeze keeping the panels ventilated, cell temperatures might sit at 15–20°C. That's 5–10°C below STC, giving roughly +1.75–4.4% extra power — 10–26W on a 600W array. Cold cells help, but not enough on their own to explain 92W of headroom.
Reason Two: The Edge of Cloud Effect
This is the one that produces the big spikes, and it's genuinely counterintuitive: clouds can make panels produce more power than a perfectly clear sky.
How Normal Irradiance Works
On a clear day, panels receive solar irradiance from two sources:
- Direct beam radiation — photons travelling in a straight line from the sun's disc, roughly 800–900 W/m² at sea level
- Diffuse sky radiation — light scattered by the atmosphere across the whole sky dome, typically 100–150 W/m²
Total: around 1,000 W/m² at solar noon — exactly what STC is calibrated to.
What Clouds Add
Cumulus clouds are extraordinarily bright. Their albedo — the fraction of incoming light they reflect — sits between 0.6 and 0.9. A large cumulus in direct sunlight is bouncing the majority of the solar energy hitting it back out in all directions, including downward toward the panels.
When the sun sits at or just beyond the edge of a cloud, three things happen simultaneously:
- The direct beam is unobscured — full direct radiation from the sun's disc still arrives
- The bright cloud face adds reflected diffuse radiation — the sunlit cloud acts as a large secondary light source, scattering additional energy toward the array from a wide angle
- Circumsolar enhancement — the bright cloud edges immediately surrounding the sun's disc scatter additional high-intensity light. This small region of sky contributes far more energy per degree of arc than the rest of the sky dome
The combined effect can temporarily push ground-level irradiance to 1,200–1,400 W/m² or higher. Field measurements regularly record values above 1,300 W/m² during broken-cloud conditions.
Running the Numbers
Take 1,200 W/m² (a modest enhancement) combined with cells at 15°C:
- Irradiance at +20% over STC → panels produce 20% more: 600W × 1.20 = 720W potential
- Temperature at 10°C below STC → additional +3.5%: 720W × 1.035 = 745W potential
In practice, conversion losses and the charge controller ceiling bring the realised figure down — but the physics comfortably accounts for the 692W reading.
Why It Doesn't Last
The geometry has to be just right — the sun peeking around a large sunlit cloud with the reflection angle facing the panels. It typically lasts tens of seconds to a few minutes before the cloud moves. A 5-minute average reading would bury the spike entirely.
The Data So Far
The peak power sensor is relatively new, so there are only eight days of history — but it's already telling:
| Date | Peak (W) | Over 600W? |
|---|---|---|
| 6 Apr | 519 | — |
| 7 Apr | 512 | — |
| 8 Apr | 480 | — |
| 9 Apr | 409 | — |
| 10 Apr | 540 | — |
| 11 Apr | 681 | ✓ |
| 12 Apr | 639 | ✓ |
| 13 Apr | 692 | ✓ |
The earlier days were either overcast, uniformly clear, or at a sun angle that didn't produce the enhancement. The pattern is consistent: overpower events happen specifically on days with large cumulus clouds and intermittent direct sun.
How the System Works and Where the Ceiling Is
Understanding why 692W is probably the maximum the system can deliver — not just a peak — requires knowing how the rest of the system is put together.
The panels feed into a Victron SmartSolar MPPT 100/50 charge controller. The MPPT's job is to constantly adjust its own input resistance to keep the panels operating at their maximum power point — the exact combination of voltage and current where they deliver the most watts. It then converts that power to whatever voltage the battery needs, charging it efficiently.
An 800W inverter runs off that battery and powers household loads — typically around 210W for normal usage. The inverter never sees panel output directly; it only draws from the battery. The MPPT sits between the panels and everything else.
MPPT stands for Maximum Power Point Tracking — it's the algorithm that makes this work. The panels have one ideal operating voltage (Vmp) at any given irradiance and temperature. The MPPT sweeps the operating point continuously to find it, which is why a well-matched solar charge controller extracts significantly more energy than a simple direct-connection setup.
The SmartSolar 100/50 has two key limits:
- Input: 100V maximum Voc — the maximum open-circuit voltage it can accept from the panels. The array sits at around 45–51V depending on temperature, comfortably within this.
- Output: 50A maximum charge current — the maximum current it will push into the battery, regardless of how much the panels could theoretically produce.
That 50A output limit is almost certainly what produced the 692W reading. Battery voltage during charging sits at around 13.8V. Multiply:
50A × 13.8V = 690W
That's almost exactly the 692W peak. When the panels pushed more than the controller could pass at 50A, it clamped its output — and 692W is what came out. The panels were likely producing more than that in the moments of peak cloud enhancement; the MPPT just couldn't deliver it.
It's also worth being clear about what "peak" means here. The 692W figure is a momentary maximum — the highest instantaneous reading the sensor captured, probably held for a matter of seconds as the cloud geometry aligned perfectly. It doesn't mean the array sustained 692W for a meaningful period. Daily energy generation (measured in kWh) is what actually matters for how much the system contributes, and that's determined by the area under the whole day's power curve — not the brief spike at the top.
As the battery charges toward full and voltage rises toward the absorption level (~14.4V), the ceiling rises slightly:
| Battery voltage | Max output (50A × V) |
|---|---|
| 13.5V | 675W |
| 13.8V | 690W |
| 14.4V | 720W |
Could the Array Be Expanded?
The 50A output ceiling means adding more panels wouldn't raise the peak — the controller will still cap at 50A on a bright noon. What extra panels would do is extend the time each day that the system produces meaningful power: early mornings, late afternoons, overcast days, and winter months when irradiance is low and the array is working well below the 50A limit.
The input voltage limit (100V) leaves plenty of room for additional panels. The two existing strings sit at ~45–51V across the temperature range. Another parallel string of two panels in series would add around 200W of rated capacity at ~45V — well within limits, and requiring no changes to the existing wiring.
Whether that's worthwhile depends on how much of daily consumption falls in those shoulder hours versus peak midday sun. For a system where most load runs in the morning and evening, it would make a real difference. For a system where the main draw is at noon, less so.
The 692W peak is the array showing the controller is already saturating on a good day. The opportunity isn't to go higher at peak — it's to reach that saturation point sooner each morning, and hold it for longer.