Yesterday afternoon a temperature alarm fired during a combined charger-and-solar pull. The busbar end of my battery cable hit 76°C — well above where I wanted to be operating, and hot enough that the cable's plastic and the surrounding hardware would have aged measurably if it kept happening. By the next morning I'd diagnosed the root cause, ordered replacement parts, and predicted what the new readings should look like. By that evening the new busbars were in and the numbers confirmed the diagnosis was right.
That whole loop — alarm, diagnosis, action, verification — only happened because two £3 temperature sensors had been quietly logging the cable for months. Without them: no alarm, no data, no story. The cable would have run silently hot on every sunny afternoon, the lug crimps and insulation would have aged invisibly, and the first sign of trouble would have been a smell, a melt, or a fault. The busbars are the headline. The sensors are the actual story.
This is part of an ongoing project — a Fogstar Drift 6.7 kWh LiFePO4 battery with seven 100W panels, a Victron MPPT 100/50, a Phoenix 12/800VA inverter, and a 50A LiFePO4 grid charger. Two DS18B20 temperature sensors clamped to the red battery cable, one at each lug, with a fuse in the middle. Long-term statistics in Home Assistant track everything. The fix below was justified end-to-end by data those probes collected.
The Original Problem
The busbar end of the cable was consistently running 15–20°C hotter than the battery end during charging — and on combined-source peaks, when the grid charger and solar both hammered the same path simultaneously, it was hitting 76–77°C and tripping my own panic alarm. That number was high enough to take seriously: well below the cable insulation's 105°C rating, but well above where I wanted to be operating long-term, and a bad place to be if anything else went wrong on top.
So yes, I was concerned. That's what drove the swap. The two DS18B20 probes on the cable had been showing me the asymmetry for weeks, the panic alerts had fired more than once, and the question was whether to ignore it, raise the threshold, or fix the underlying cause. I chose the third.
It boiled down to geometry. The battery end of the cable is bolted to a 6.7 kWh LiFePO4 pack — a giant heatsink. Heat hits it and gets absorbed instantly. The busbar end, on the other hand, was bolted to a small copper bar with very little thermal mass. Whatever heat the fuse and lug joints dumped into that end just stayed there.
Even with perfect electrical connections, the temperatures would have been unequal. The 15-20°C delta was physics, not fault. Operating at moderate currents was fine. It was when solar surged on top of the grid charger that the cable hit 76°C and tripped my panic alarm.
I²R, Briefly
Heat dissipated in any conductor is P = I² × R: power equals current squared, times resistance. The squared bit is the killer. Doubling current quadruples the heat.
So when my system went from 42A (charger only) to 76A combined (charger + solar), the current didn't quite double, but the heat tripled. The undersized busbar had no way to absorb that, and the temperature climbed accordingly.
Bigger busbars don't help much with the cable's intrinsic R — the OceanFlex 70mm² tinned copper was already chunky. What they do is provide thermal mass to soak heat, more stud positions to spread connection points, and lower joint resistance through proper full-contact M8 lugs. The energy savings from reduced losses are marginal — maybe £2-3 a year. The real win is thermal margin and component longevity.
The Hardware: £12 Amazon vs £120 Victron
Worth being specific about what actually got swapped, because the spec sheet alone doesn't tell the story.
The old busbar was a generic Amazon part — about £12, no brand worth mentioning, marketed as "150A rated" with M8 stud terminals. On paper that should have been fine. Here's what's actually flowing through my system at any given time:
- Grid charger: about 50A when running (the Fogstar 50A LiFePO4 unit, drawing ~615W DC after AC conversion)
- MPPT solar input: up to 50A at the controller's hard limit (Victron 100/50; my array peaked at around 55A on the DC bus when 726W was coming in)
- Inverter discharge: 10–20A continuous, pulling power out for the microgrid (240W peak observed on a busy evening)
The cable doesn't see all of those summed — charger and solar push current in, inverter pulls some out. The net battery cable current is what you'd compute from the algebraic sum. In normal operation that's 30–50A. The worst-case spike I've actually measured was 78A through the cable when the charger was on full tilt and solar surged simultaneously — about 88A combined source current arriving at the busbar before the inverter took its 10A out.
So 78–88A real-world peak. Well inside a "150A rating" with margin to spare, on paper. In practice, ratings on cheap hardware mean something very different to ratings on industrial kit.
What "150A" usually means on a £12 bar from a no-name listing: tested at 25°C ambient, in open air, with the rated current applied for short bursts. No de-rating curve published for sustained operation at warmer ambients. Copper of unknown purity, often aluminium plated to look like copper, neither tinned nor coated against oxidation. Threaded posts pressed (not welded) into a thin base that flexes under bolt torque. A surprisingly small overall mass — most of the "busbar" turns out to be air-gap and plastic spacer once it's in the hand.
That tells me what was actually happening on my old setup. The bar might have survived an instantaneous 150A pulse for marketing-photography purposes, but it couldn't soak the heat from a sustained 80A run. The thin base flexed when I torqued the bolts, leaving joints with marginal contact area. And the small thermal mass meant whatever heat was generated had nowhere to go — it just kept raising the bar's temperature. Exactly the failure mode the sensors were catching.
The replacement is two Victron Energy 250A busbars (12-stud, with covers — Victron product code VBB125021220), total £120. Same M8 stud spec, dramatically different physical part:
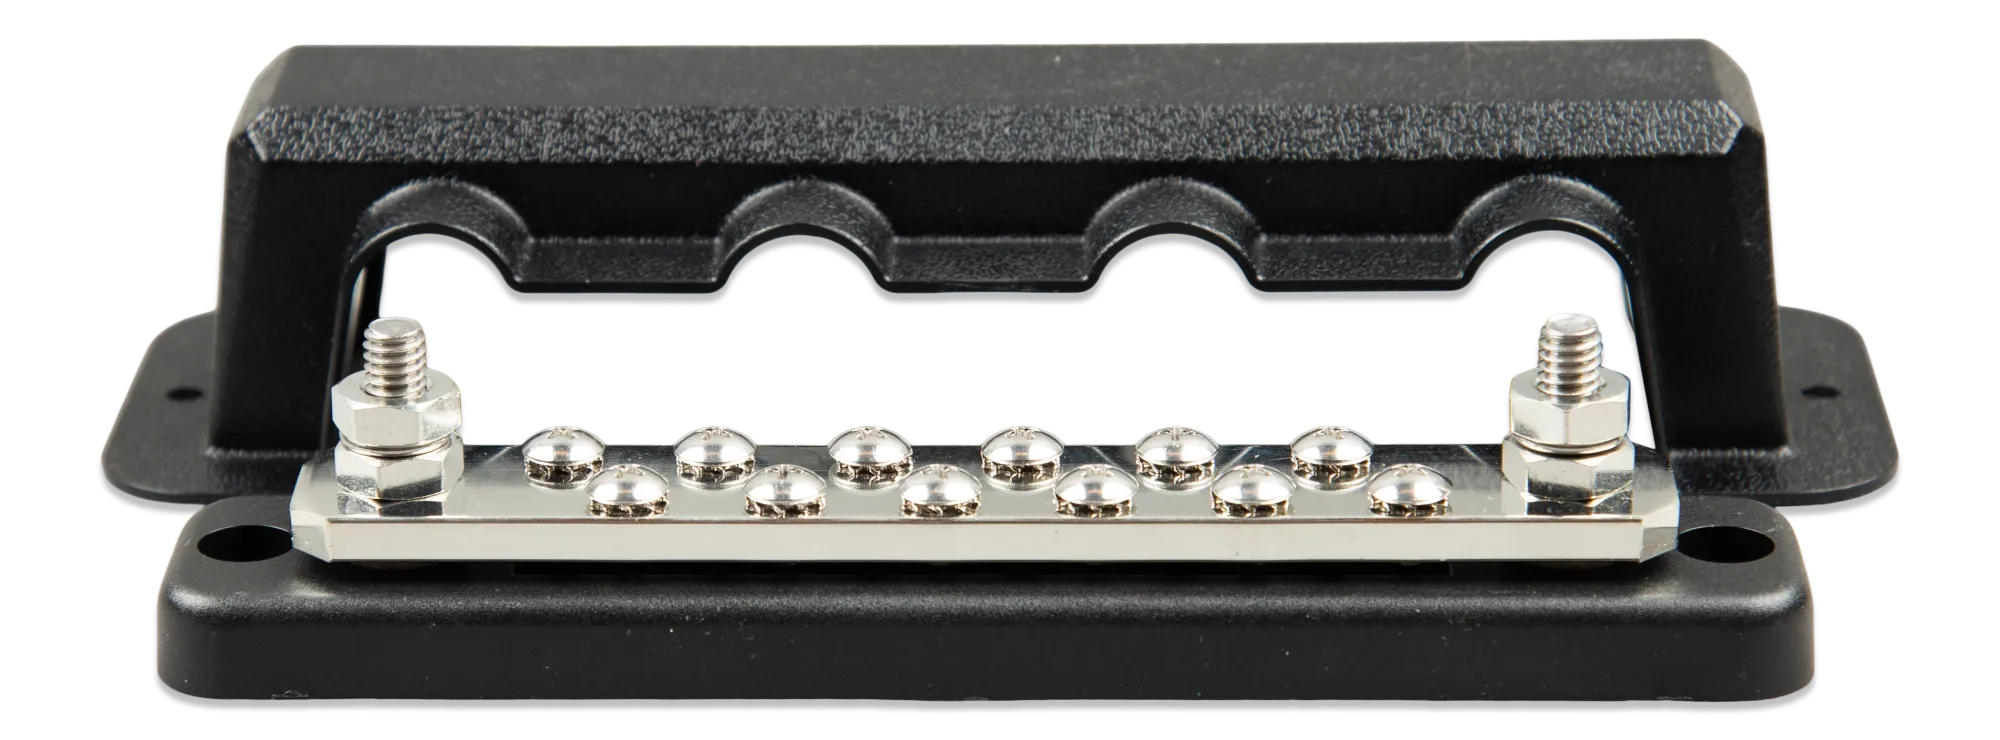
- 250A continuous rating, with a published de-rating curve and real thermal documentation
- Solid tinned-copper base, several times the cross-section of the original
- Six brass studs welded to the bar — not pressed in — so torquing a lug doesn't deform the bar itself
- Insulating polycarbonate cover that snaps over the studs, eliminating accidental short-circuits during maintenance
- Visibly heavier in the hand — the thermal mass is doing real work the moment current starts flowing
Ten times the price for what looks like the same job. The price difference paid for: real engineering, real ratings, conservative materials, and a part that was actually built for sustained current rather than nominal headlines on a product listing.
This is the kind of decision where the spec sheet lies more politely on cheap hardware. "150A rated" with no context is closer to marketing than engineering. A proper data sheet — with continuous ratings, de-rating curves, certification, and material specifications — is a different document entirely. And a different part.
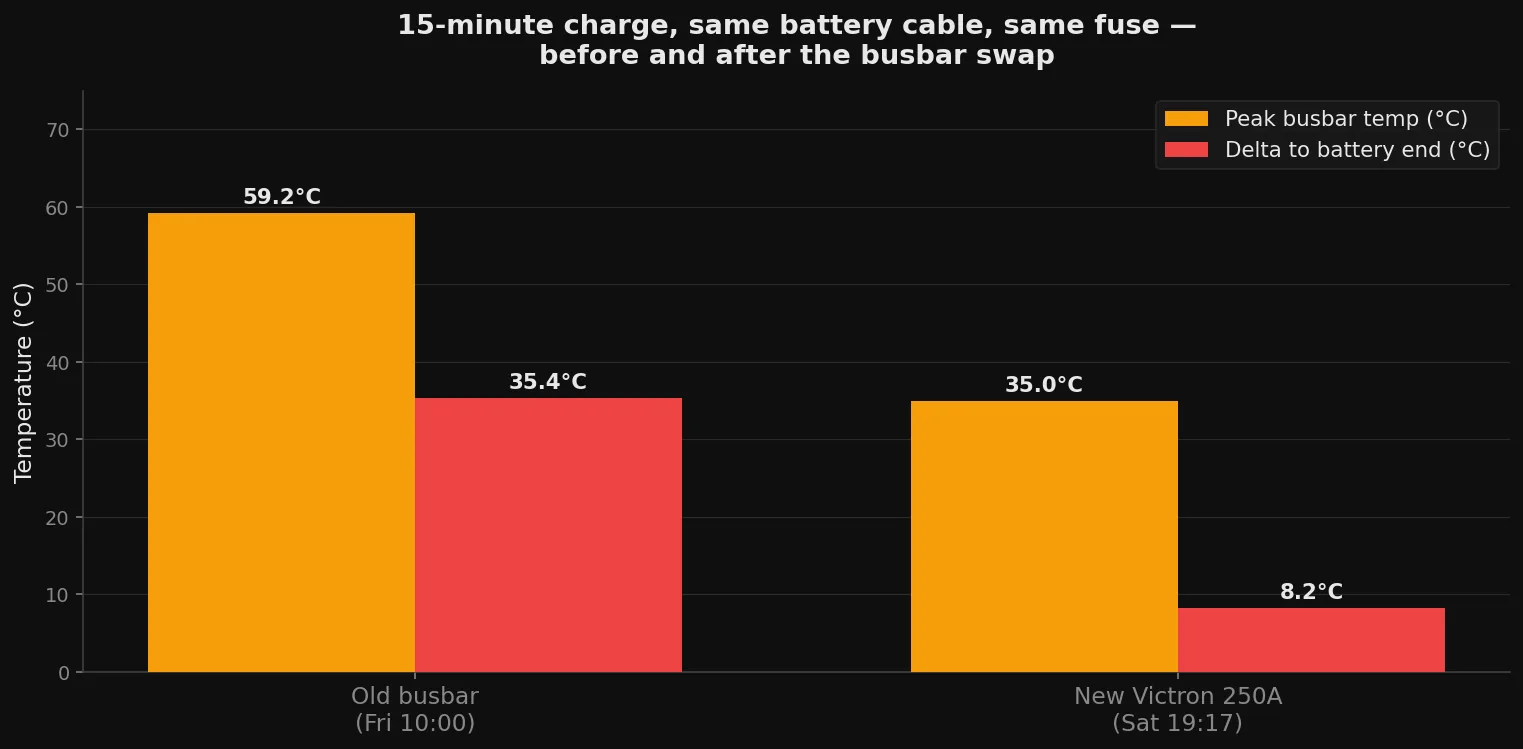
The 15-Minute Comparison
The clearest test was a 15-minute charge under similar conditions, before and after the swap.
| Old busbar (Fri 10:00) | New busbar (Sat 19:17) | |
|---|---|---|
| Pre-charge busbar temp | 26.2°C | 28.1°C |
| Peak busbar temp | 59.2°C | 35.0°C |
| Peak battery-end temp | 31.9°C | 31.7°C |
| Delta busbar–battery | 35.4°C | 8.2°C |
| Avg current | 39.4 A | 33.1 A |
| Busbar rise above baseline | +33.0°C | +6.9°C |
Same cable. Same fuse. Same charger. Roughly the same current. Five times less heating at the busbar end.
Even normalising for the slight current difference (today was 33A, the old test was 39A — about 70% of the I²), the new setup runs about 3.5× cooler. The geometry is now closer to symmetric: both ends of the cable have meaningful thermal mass, so heat has somewhere to go on either side rather than piling up at the small end.
Two Hours of Real Charging
The 15-minute test gave one snapshot. The next afternoon, an Octopus Agile cheap-slot window booked a continuous two-hour charge — same 750 W charger, ~43 A pack current, light afternoon solar adding another ~70-140 W. That's the proper test: sustained load, not a quick bump.
The cable handled it as if it weren't even there.
| Metric | Old busbar (yesterday, ~39 A) | New busbars (today, ~43 A, 2 h continuous) |
|---|---|---|
| Peak busbar temp | 59.2°C | 33.3°C |
| Peak battery-end temp | 31.9°C | 31.7°C |
| Delta busbar–battery during charge | +27 to +35°C | +0.5 to +1.6°C |
| Cooldown after charger off | hours | 5°C drop in 15 min |
| Idle delta (inverter only) | +8 to +12°C | +0.2°C |
Two hours of continuous charging, slightly higher current than yesterday's reference, and the busbar peaked 26°C cooler than the old bar did at the same load. The cooldown was equally dramatic — busbar dropped from 33°C back to 26°C inside 15 minutes of the charger ending, and was indistinguishable from room temperature 30 minutes later. The old setup took hours to come down from comparable peaks because the small thermal mass had heat-soaked the surrounding metalwork; the new bars simply don't accumulate.
The +0.5 to +1.6°C delta between busbar and battery ends during sustained charging is the most telling number. With the old bar that delta was 27°C minimum under the same load — pure geometry, the small busbar saturating while the battery pack absorbed everything thrown at it. With both ends now sized appropriately, heat has somewhere to go on either side, and the gradient barely forms. The thermal asymmetry that made the old setup readable is gone.
The remaining "still untested" regime is the combined-source peak — bright afternoon clearance with the charger running and 700 W+ of solar simultaneously, the load that pushed the old setup to 77°C. That'll happen on the next sunny day inside a charge window. The prediction, given today's numbers, is that the new bars top out somewhere in the 45-55°C range — comfortably below the 70°C panic threshold with proper headroom rather than the old setup's nervous margin.
First combined-source data point — 12 May 2026
Partial answer to the "still untested" question above, captured across a full Agile charging window with the household awake and solar adding to the bus.
The conditions: charger plug on continuously across the morning's Agile slots, ~46 A net into the battery, microgrid pulling ~180 W AC out simultaneously (around 16 A DC across the busbar to the inverter), light cloudy solar adding another ~150–250 W to the bus across the window. Not the full 700 W summer-peak regime yet, but the first dataset where charger, inverter, and solar were all active across the busbar junction at the same time.
The busbar end peaked at 44.7°C at 13:53 BST, battery end at 38.9°C a minute later — a 5.8°C peak delta. Mid-window readings settled around 41°C / 37°C. The combined cross-current across the busbar (~46 A in from the charger plus ~16 A out to the inverter ≈ 62 A of through-traffic) is the kind of load the old £12 bar used to settle at 55–65°C under similar conditions, with a +25 to +35°C delta to the battery end. The new bar's 45°C peak with a 6°C delta is sitting comfortably inside the 45–55°C range I predicted for this regime.
So the model holds so far: at moderate combined-source loads the new busbars run roughly 10–15°C cooler than the old part did, and the geometry-driven asymmetry has dropped from "obvious to the eye" to a few degrees that match what cable I²R alone would produce. The 700 W solar combined-source peak — full afternoon clearance with the charger still running — is the next test. The prediction stands at 50–55°C, well clear of the 70°C panic threshold. I'll add that data point when it happens.
The everyday case — overnight inverter draw at 10 A continuous, no charger — is now thermally invisible. The cable sits at 24-25°C parked alongside the rest of the room, +0.2°C delta between ends. The old bars showed a clear 8-9°C bump during the same kind of evening; visible enough that I could tell from a glance at the dashboard whether the TV was on. That signal has gone away, replaced by a flat trace.
The £3 Decision That Made This Visible
None of this story would have existed without the two DS18B20 probes I clamped to the cable months ago. They cost about £3 each. They sit on the same Zigbee bridge as half a dozen other temperature sensors around the flat. They are, by some distance, the highest-leverage instrumentation I've added to this build.
Without them, the original busbar would have been running 76°C+ on every combined-source afternoon for months, quietly aging the lug crimps and browning the insulation around the joint. None of that shows up on a battery dashboard — the BMS reports cell voltages, cell temperatures, balance state, SOH, but it has no idea what's happening on the wire between itself and the bus. The first sign of trouble would have been a smell, a melt, or a fault — and at that point you've already lost a lug, a fuse, or worse.
The general principle worth taking away: when you build a system around expensive components, instrument the cheap stuff between them. Battery, charger, MPPT, inverter — all of those come with their own telemetry. The cable, the lugs, the busbar, the fuse: nothing watches those by default, and they're exactly where the slow failure modes live. Lug oxidation, joint resistance creep, fuse age, undersized hardware running hot — every one of them is silent until it isn't.
£6 of sensors caught a £120 problem before it became a £700 one. The wire between the battery and the bus is the single most important piece of monitoring this setup has, and it's also the cheapest. If I were starting a battery-and-solar build from scratch, the temp probes on the high-current cable would go in before anything else.
What This Tells Me
Three things stand out from this single 15-minute test:
First, the original 35°C delta really was geometry. With a properly sized busbar in place, the delta drops to a normal 8°C — which is what I'd expect from the fuse dissipating a few watts in series with the cable, not a connection problem at either end. Future drift in that delta would now genuinely flag a degrading joint, because the geometric explanation no longer accounts for it.
Second, the combined-source peaks that pushed the old setup to 76°C should now top out comfortably below 50°C. The £120 has bought meaningful headroom for sustained summer charging plus solar surges, and quietly extended the service life of every connector and lug in that current path through Arrhenius — every 10°C of cooling roughly doubles component life.
Third, my temperature alerting can stay tighter. I had briefly raised the panic threshold from 70°C to 80°C earlier today to suppress alarms on the legitimate combined-source peaks. That's now back at 70°C, where it should be — anything cracking 70°C with the new bars in place would be a real signal worth investigating.
What's Still Worth Measuring
Two things on the to-do list. First, whether the negative cable shows similar improvement once I add DS18B20 sensors at its lugs — symmetric instrumentation will give a complete picture rather than just the red side. Second, whether the annual energy savings from the lower joint resistance show up as a visible signal on the per-month cap-vs-Agile accounting. The estimated £2-3/year of efficiency gain is below noise on a one-month window but should be detectable across a full year.
For now, the headline holds across everything I've watched: same cable, same fuse, similar (slightly higher) load, busbar runs 26°C cooler at peak charge, the busbar-vs-battery delta during charging has dropped from +35°C to under +2°C, idle is thermally invisible, and cooldown takes minutes instead of hours. £120 well spent.
The Real Takeaway
The busbar swap is the thing in the photos. The numbers go in a table. The £120 cost goes on the ROI page. All of that is the visible end of the story.
The actual win was a decision I made months ago: clamp two cheap temperature probes to the high-current cable and let them log to a database every minute. That decision is what made the alarm fire on the bad afternoon. It's what gave me the historical record showing 15–20°C delta across every charge cycle. It's what let me predict the post-swap behaviour and verify it once the new bars were in. None of those steps work without the data.
If you've built — or are building — a battery, solar, or any kind of high-current home setup: instrument the wire. Cells get watched by their BMS. Loads get watched by their plugs. The cable, the lugs, the fuse, the busbar — the parts that fail silently and slowly — almost never get watched at all unless you make a deliberate choice to add the probes. Two DS18B20s and a Zigbee bridge cost less than a takeaway and turn an opaque path into a graph you can read. The next failure they catch will more than pay for them.
Better data made a better decision possible. That's the entire post.