 elyob
elyob
There's a small box in my back garden that does nothing but count aeroplanes. It's not glamorous — an old Raspberry Pi I had spare, sealed in a waterproof case, wired to an external aerial and a little USB radio dongle. That's the whole rig: a home ADS-B receiver that feeds FlightRadar24, logging how many aircraft it can hear overhead at any given moment and handing the number to Home Assistant.
That feed earns me one of their contributor accounts — the kind that would otherwise run about £400 a year — so the thing more than pays for its own trickle of electricity. Most days it's wallpaper. This week it caught a national air-traffic failure in real time, and then caught the recovery.
The event was the NATS one. On the afternoon of the 8th, the UK's air-traffic-control provider had a failure in its flight-processing system and throttled departures across the country — close to a thousand flights delayed or cancelled, Heathrow to Scotland. The fault was flagged around 1:46pm and fixed by roughly 4:40pm, but crews and aircraft were left out of position for hours after.
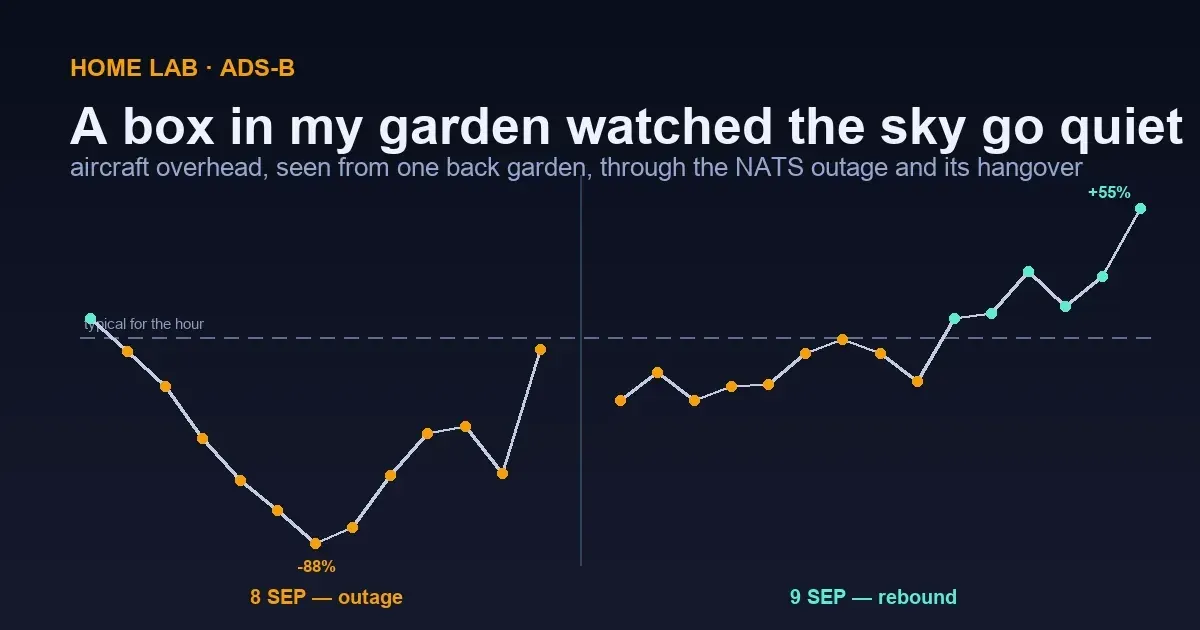
I didn't need the news to know. My little counter sat at its usual daytime level — the mid-to-high teens of aircraft overhead — right through the morning. Then, from about 1pm, as the restrictions bit, it fell off a cliff.
Down 43% by 2pm. Down 74% by 4pm. It bottomed at nearly 90% below normal at 5pm — and that floor arriving after the fix is the honest, slightly counter-intuitive bit: switching a flow-control system back on doesn't teleport aircraft into the sky. It didn't recover to normal until 11pm. Every hour from 1pm to 10pm sat below the quietest that same hour had managed all the previous week.
The receiver keeps two counts — the aircraft it's tracking, and the ones it successfully uploads to FlightRadar24 — and both traced the identical curve, so it wasn't one sulking sensor. That's the first thing to rule out, because a dead receiver and an empty sky look exactly the same on a graph. The giveaway that this was real: the morning was utterly ordinary. A broken box doesn't politely wait until 1pm to fail.
I'd assumed the high-level traffic would be spared — aircraft crossing the country at cruising height, nothing to do with any UK airport — and the data put me right. Splitting the afternoon by altitude (on the roughly half of contacts that report one), the en-route band above 25,000 feet fell about 56%, and the terminal traffic below it about 67% — the overflights barely less hammered than the departures and arrivals. At the worst hour the high band was down around 90% too.
Which makes sense once you know what actually broke. A flight-processing system handles the flight plans for everything moving through UK airspace — overflights included, not just movements at airports. Throttle it and you thin out even the traffic that was only passing over. The sky didn't just lose its take-offs and landings; it lost most of its through-traffic with them.
The 9th turned out to be the more interesting shape, and now the whole day's in — all twenty-four hours. Three acts. The small hours ran oddly busy, though that's a handful of aircraft against a near-empty baseline, so I wouldn't lean on it. The morning was still visibly short — down a fifth to a quarter, a couple of hours dipping below anything the previous week managed. And then the afternoon went the other way entirely.
From about 3pm the count climbed above normal and simply kept climbing — 7pm up 26%, 8pm up 55%, 9pm up 78%, each busier than that hour had ever been all week. It crested at 9pm and was still running some 40% above normal when midnight cut the day off — the rebound hadn't actually finished.
Across all twenty-four hours the day averaged out to within a whisker of normal — plus 0.3% — but not by quietly recovering. A morning that ran up to 27% below normal was cancelled by an evening that ran up to 78% above it: quiet all morning, unusually busy all evening, the two almost exactly offsetting. On a thin six-day baseline, so hold the precision loosely — but it's a striking way for a day to balance, and about as close as a bare aircraft count gets to showing a backlog clearing overhead.
And even at the 8th's floor the count never quite reached zero — a handful were still getting down. The one that made me look twice was an Air China jet coming into Gatwick mid-afternoon — a carrier that serves Heathrow, not Gatwick, so it had plainly been displaced. The airspace was never actually closed, only choked to a trickle, so it wasn't sneaking in; it simply held one of the few slots still going when almost nothing else was.
Which brings me to the part I only half-realised I'd built. Nothing on the little Pi keeps any of this — the decoder overwrites itself every half hour. What hoards the history is Home Assistant, entirely by accident: the sensor that hands me the count is really polling the decoder every ten seconds for the whole list of aircraft, and because Home Assistant stores a sensor's attributes as well as its value, it's been quietly archiving every callsign, position, altitude and speed that came along. Nobody set out to build a flight database; it fell out of a dashboard wanting a number. (I only clocked it while writing this — and promptly stretched the history from a week to a fortnight.)
The rest of that afternoon is all still sitting in the archive — every callsign and flight path, there for the trawling if I ever fancy it. Mostly I don't; the shape alone told me what I wanted to know.
(5pm)
whole day
morning dip
(9pm peak)
(24 hours)
One last look the next morning, to be sure it had actually cleared. A little of the surge did spill past midnight — the small hours of the 10th ran high — but it was gone by dawn, and through the working morning, to 9am, the sky was back to normal: a shade below it if anything, around eight per cent down, well inside the ordinary day-to-day wobble. So the backlog cleared inside the 9th; it didn't drag into a second day.
Still — I find it quietly astonishing. An old spare Pi in a waterproof box in the garden, feeding a hobbyist flight-tracking network and plumbed into the same Home Assistant that runs my lights, sat there and recorded a piece of national infrastructure falling over and getting back up — as a shape I could read off a chart the next morning. I wasn't watching. It was just keeping the number, the way it always does.